. 2008 Aug 15;17(16):2496-506.
doi: 10.1093/hmg/ddn150. Epub 2008 May 16.

Depletion of mitochondrial DNA in fibroblast cultures from patients with POLG1 mutations is a consequence of catalytic mutations

Affiliations

Depletion of mitochondrial DNA in fibroblast cultures from patients with POLG1 mutations is a consequence of catalytic mutations

Neil Ashley et al. Hum Mol Genet. .

Erratum in

  • Hum Mol Genet. 2009 Dec 15;18(24):4905-6

Abstract

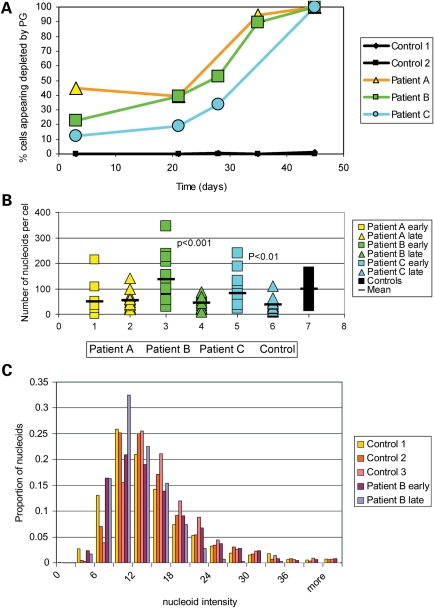
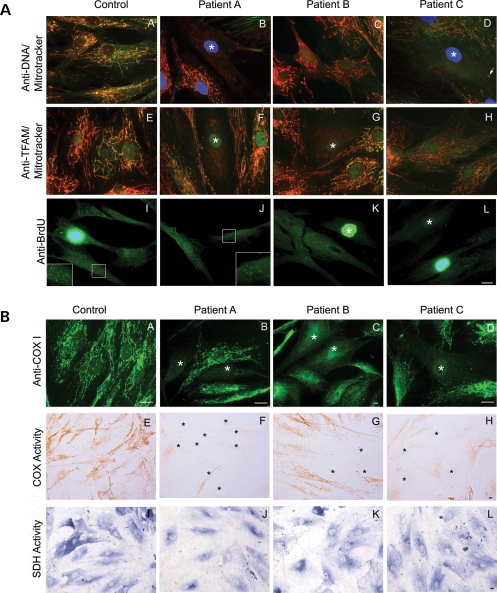
We investigated clinical and cellular phenotypes of 24 children with mutations in the catalytic (alpha) subunit of the mitochondrial DNA (mtDNA) gamma polymerase (POLG1). Twenty-one had Alpers syndrome, the commonest severe POLG1 autosomal recessive phenotype, comprising hepatoencephalopathy and often mtDNA depletion. The cellular mtDNA content reflected the genotype more closely than did clinical features. Patients with tissue depletion of mtDNA all had at least one allele with either a missense mutation in a catalytic domain or a nonsense mutation. Four out of 12 patients exhibited a progressive, mosaic pattern of mtDNA depletion in cultured fibroblasts. All these patients had mutations in a catalytic domain in both POLG1 alleles, in either the polymerase or exonuclease domain or both. The tissue mtDNA content of patients who had two linker mutations was normal, and their phenotypes the mildest. Epilepsy and/or movement disorder were major features in all 21. Previous studies have implicated replication stalling as a mechanism for mtDNA depletion. The mosaic cellular depletion that we have demonstrated in cell cultures may be a manifestation of severe replication stalling. One patient with a severe cellular and clinical phenotype was a compound heterozygote with POLG1 mutations in the polymerase and exonuclease domain intrans. This suggests that POLG1 requires both polymerase and 3'-5' exonuclease activity in the same molecule. This is consistent with current functional models for eukaryotic DNA polymerases, which alternate between polymerizing and editing modes, as determined by competition between these two active sites for the 3' end of the DNA.


Figures

Figure 1.
Figure 1.
PicoGreen staining reveals marked mtDNA depletion in certain MDS patient derived fibroblast cell cultures, that alters with cell passage (A) PicoGreen staining of a later passage of patient A's cells showed a very weak nucleoid staining, and nucleoids were barely visible in most cells. (B) PicoGreen staining of a later passage of patient B's fibroblasts also revealed a similar decline in nucleoid staining, compared with earlier passages. (C) PicoGreen staining of later passage patient C's fibroblasts. (D) Patient D showed occasional depleted fibroblasts. (E) There was little difference in PicoGreen staining of early passage (p4) fibroblasts and (F) late passage fibroblasts (p25) derived from healthy control. Insets show magnified areas of interest. Bars 20 µm.
Figure 2.
Figure 2.
(A) Quantification of PicoGreen staining of proportion of mosaic MDS cell cultures A–C that appeared depleted over time. The number of cells that appeared depleted of mtDNA increased over 45 days in the patients but not the controls (200 cells were counted at each time point). Numbers were significantly higher in patients than controls at all time points, other than 28 days (0.05<P < 0.0016). (B) Quantification of the numbers of nucleoids visible by PicoGreen staining of mosaic MDS cell cultures A–C and controls [same experiment as (C) and Supplementary Material, Fig. S2]. Nucleoid numbers drop with time in MDS cultures (P < 0.001 and <0.01 for early and late time points for patients B and C, respectively). In all three patients the number of nucleoids at the late time points are significantly fewer than controls (P < 0.0002). (C) Quantification of the intensity of PicoGreen staining of indiviual nucleoids from mosaic MDS cells [same experiment as (B) and Supplementary Material, Fig. S2]. The distribution of nucleoid intensities is similar in patients (early and late passage) and controls (only patient B is shown, whose nucleoid numbers showed the most significant drop).
Figure 3.
Figure 3.
(A) MDS cells are mosaic for expression of mtDNA and mitochondrial transcription factor A (TFAM) and have reduced mtDNA synthesis compared with controls. (a) Control fibroblasts co-labelled with anti-DNA antibody (green) and Mitotracker red, showing orange-yellow labelling were there two signals co-localize. (b) Patient A fibroblasts co-labelled with anti-DNA/Mitotracker. (DAPI was used to visualize nuclei blue and an asterisk denotes a cell with no anti-DNA signal). (c) Patient B fibroblasts co-labelled with anti-DNA/Mitotracker. (note: a reduced anti-DNA signal is shown by the predominantly red co-localization with Mitotracker). (d) Patient C fibroblasts co-labelled with anti-DNA/Mitotracker (arrow shows area of residual anti-DNA/mitotracker co-labelling within a depleted cell with reduced Mitotracker labelling). (e) Control fibroblasts co-labelled with anti-TFAM antibody (green) and Mitotracker red. (f) Patient A fibroblasts co-labelled with anti-TFAM/Mitotracker (asterisks show TFAM depleted cells with reduced Mitotracker labelling). (g) Patient B fibroblasts co-labelled with anti-TFAM/Mitotracker. (h) Patient C fibroblasts co-labelled with anti-TFAM/Mitotracker. (i–l) Fibroblasts pulsed with Bromodeoxyuridine (BrdU) for 220 min, and Br-DNA immuno-detected. (i) BrdU labelling of normal fibroblasts, (j) BrdU labelling of patient A cells (inset shows magnified area of cytoplasm showing weak BrdU labelling). (k) BrdU labelling of patient B cells. (l) BrdU labelling of patient C cells (note: asterisks mark ‘ρ° type’ cells with very little or no mtDNA labelling). Bar 20 µM. (B) Expression of mtDNA encoded cytochrome c oxidase subunit I (COXI) in MDS patients is reduced, as is COX activity, but not SDH activity. Cytochrome c oxidase subunit I (COXI) expression was monitored using immuno-cytochemistry. (a) COXI labelling of normal control fibroblasts. (b) COXI labelling of patient A fibroblasts (COXI depleted cells are asterisked). (c) COXI labelling of patient B fibroblasts. (d) COXI labelling of patient C fibroblasts. (e–h) Histochemical demonstration of in situ COX activity in fibroblasts. (e) COX activity of control. (f) COX activity of patient A cells (asterisks denote cells with markedly reduced activity). (g) COX activity of patient B cells. (h) COX activity of patient C cells. (i–l) Histochemical demonstration of in situSDH activity in fibroblasts. (i) SDH activity of control cells. (j) SDH activity of patient A cells. (k) SDH activity of patient B cells. (l) SDH activity of patient C cells. Bars 20 µM. (C) Tetramethyl-rhodamine-methyl ester (TMRM)/PicoGreen co-labelling of mosaic MDS fibroblast mitochondrial membrane potential. (a) PicoGreen labelling of normal control fibroblasts. (b) Co-staining of the same cells with TMRM. (c) Co-localization of the two signals in (a) and (b). (d and e) PicoGreen/TMRM co-labelling of later passage Patient A's fibroblasts. (f) Co-localization of the two signals in (d) and (e). (g and h) PicoGreen/TMRM co-labelling of later passage Patient B's fibroblasts. (i) Co-localization of the two signals. (j and k) PicoGreen/TMRM co-staining of late passage Patient C's cells. (l) Co-localization of the two signals. (m and n) PicoGreen/TMRM co-staining of late passage Patient D's cells. (o) Co-localization of the two signals. Bars 20 µm.
Figure 3.
Figure 3.
(A) MDS cells are mosaic for expression of mtDNA and mitochondrial transcription factor A (TFAM) and have reduced mtDNA synthesis compared with controls. (a) Control fibroblasts co-labelled with anti-DNA antibody (green) and Mitotracker red, showing orange-yellow labelling were there two signals co-localize. (b) Patient A fibroblasts co-labelled with anti-DNA/Mitotracker. (DAPI was used to visualize nuclei blue and an asterisk denotes a cell with no anti-DNA signal). (c) Patient B fibroblasts co-labelled with anti-DNA/Mitotracker. (note: a reduced anti-DNA signal is shown by the predominantly red co-localization with Mitotracker). (d) Patient C fibroblasts co-labelled with anti-DNA/Mitotracker (arrow shows area of residual anti-DNA/mitotracker co-labelling within a depleted cell with reduced Mitotracker labelling). (e) Control fibroblasts co-labelled with anti-TFAM antibody (green) and Mitotracker red. (f) Patient A fibroblasts co-labelled with anti-TFAM/Mitotracker (asterisks show TFAM depleted cells with reduced Mitotracker labelling). (g) Patient B fibroblasts co-labelled with anti-TFAM/Mitotracker. (h) Patient C fibroblasts co-labelled with anti-TFAM/Mitotracker. (i–l) Fibroblasts pulsed with Bromodeoxyuridine (BrdU) for 220 min, and Br-DNA immuno-detected. (i) BrdU labelling of normal fibroblasts, (j) BrdU labelling of patient A cells (inset shows magnified area of cytoplasm showing weak BrdU labelling). (k) BrdU labelling of patient B cells. (l) BrdU labelling of patient C cells (note: asterisks mark ‘ρ° type’ cells with very little or no mtDNA labelling). Bar 20 µM. (B) Expression of mtDNA encoded cytochrome c oxidase subunit I (COXI) in MDS patients is reduced, as is COX activity, but not SDH activity. Cytochrome c oxidase subunit I (COXI) expression was monitored using immuno-cytochemistry. (a) COXI labelling of normal control fibroblasts. (b) COXI labelling of patient A fibroblasts (COXI depleted cells are asterisked). (c) COXI labelling of patient B fibroblasts. (d) COXI labelling of patient C fibroblasts. (e–h) Histochemical demonstration of in situ COX activity in fibroblasts. (e) COX activity of control. (f) COX activity of patient A cells (asterisks denote cells with markedly reduced activity). (g) COX activity of patient B cells. (h) COX activity of patient C cells. (i–l) Histochemical demonstration of in situSDH activity in fibroblasts. (i) SDH activity of control cells. (j) SDH activity of patient A cells. (k) SDH activity of patient B cells. (l) SDH activity of patient C cells. Bars 20 µM. (C) Tetramethyl-rhodamine-methyl ester (TMRM)/PicoGreen co-labelling of mosaic MDS fibroblast mitochondrial membrane potential. (a) PicoGreen labelling of normal control fibroblasts. (b) Co-staining of the same cells with TMRM. (c) Co-localization of the two signals in (a) and (b). (d and e) PicoGreen/TMRM co-labelling of later passage Patient A's fibroblasts. (f) Co-localization of the two signals in (d) and (e). (g and h) PicoGreen/TMRM co-labelling of later passage Patient B's fibroblasts. (i) Co-localization of the two signals. (j and k) PicoGreen/TMRM co-staining of late passage Patient C's cells. (l) Co-localization of the two signals. (m and n) PicoGreen/TMRM co-staining of late passage Patient D's cells. (o) Co-localization of the two signals. Bars 20 µm.

References

    1. Moraes C.T., Shanske S., Tritschler H.J., Aprille J.R., Andreetta F., Bonilla E., Schon E.A., DiMauro S. mtDNA depletion with variable tissue expression: a novel genetic abnormality in mitochondrial diseases. Am. J. Hum. Genet. 1991;48:492–501. - PMC - PubMed
    1. Moraes C., Ricci E., Arnaudo E., Bonilla E., DiMauro S., Schon E. Quantitative defects of mitochondrial DNA. In: DiMauro S., Wallace D., editors. Mitochondrial DNA in Human Pathology. New York: Raven; 1993. pp. 97–108.
    1. Barthelemy C., de Baulny H.O., Lombes A. D-loop mutations in mitochondrial DNA: link with mitochondrial DNA depletion? Hum. Genet. 2002;110:479–487. - PubMed
    1. Taanman J.W., Bodnar A.G., Cooper J.M., Morris A.A., Clayton P.T., Leonard J.V., Schapira A.H. Molecular mechanisms in mitochondrial DNA depletion syndrome. Hum. Mol. Genet. 1997;6:935–942. - PubMed
    1. Blake J.C., Taanman J.W., Morris A.M., Gray R.G., Cooper J.M., McKiernan P.J., Leonard J.V., Schapira A.H. Mitochondrial DNA depletion syndrome is expressed in amniotic fluid cell cultures. Am. J. Pathol. 1999;155:67–70. - PMC - PubMed

Publication types

MeSH terms