. 2008 Aug;95(4):2053-62.
doi: 10.1529/biophysj.108.130617. Epub 2008 May 16.

Novel features of the rabbit transverse tubular system revealed by quantitative analysis of three-dimensional reconstructions from confocal images

Affiliations

Novel features of the rabbit transverse tubular system revealed by quantitative analysis of three-dimensional reconstructions from confocal images

Eleonora Savio-Galimberti et al. Biophys J. 2008 Aug.

Abstract

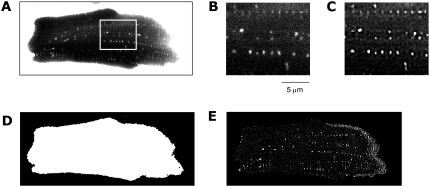
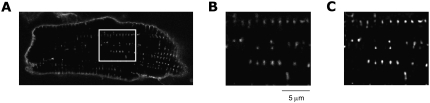
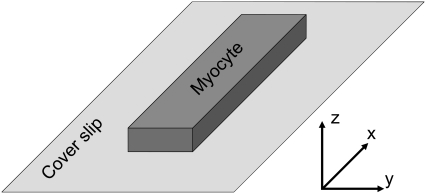
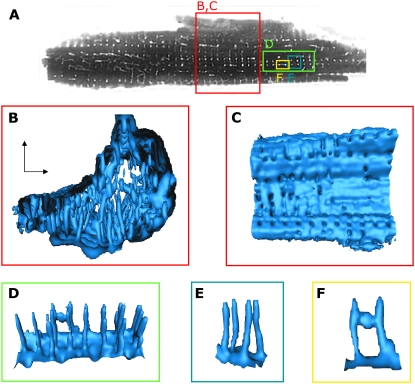
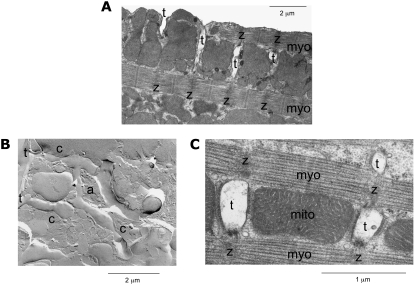
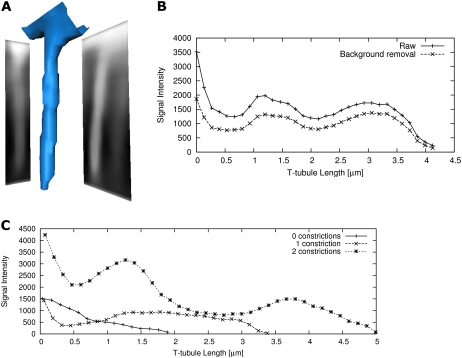
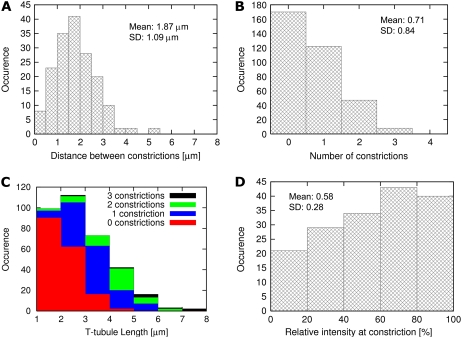
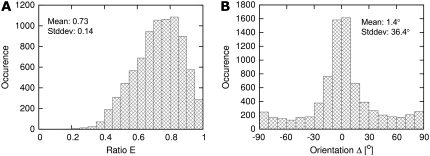
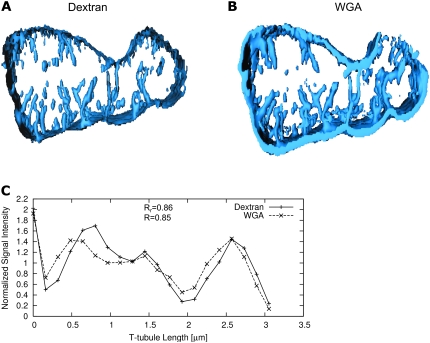
With scanning confocal microscopy we obtained three-dimensional (3D) reconstructions of the transverse tubular system (t-system) of rabbit ventricular cells. We accomplished this by labeling the t-system with dextran linked to fluorescein or, alternatively, wheat-germ agglutinin conjugated to an Alexa fluor dye. Image processing and visualization techniques allowed us to reconstruct the t-system in three dimensions. In a myocyte lying flat on a coverslip, t-tubules typically progressed from its upper and lower surfaces. 3D reconstructions of the t-tubules also suggested that some of them progressed from the sides of the cell. The analysis of single t-tubules revealed novel morphological features. The average diameter of single t-tubules from six cells was estimated to 448 +/- 172 nm (mean +/- SD, number of t-tubules 348, number of cross sections 5323). From reconstructions we were able to identify constrictions occurring every 1.87 +/- 1.09 microm along the principal axis of the tubule. The cross-sectional area of these constrictions was reduced to an average of 57.7 +/- 27.5% (number of constrictions 170) of the adjacent local maximal areas. Principal component analysis revealed flattening of t-tubular cross sections, confirming findings that we obtained from electron micrographs. Dextran- and wheat-germ agglutinin-associated signals were correlated in the t-system and are therefore equally good markers. The 3D structure of the t-system in rabbit ventricular myocytes seems to be less complex than that found in rat. Moreover, we found that t-tubules in rabbit have approximately twice the diameter of those in rat. We speculate that the constrictions (or regions between them) are sites of dyadic clefts and therefore can provide geometric markers for colocalizing dyadic proteins. In consideration of the resolution of the imaging system, we suggest that our methods permit us to obtain spatially resolved 3D reconstructions of the t-system in rabbit cells. We also propose that our methods allow us to characterize pathological defects of the t-system, e.g., its remodeling as a result of heart failure.


Figures

FIGURE 1
FIGURE 1
Image data and processing. (A) An image of a left ventricular myocyte was obtained by applying confocal microscopy and dextran-fluorescein as a marker of the extracellular space. The image consists of 896 × 356 pixels and is part of a stack of 130 images. Enlargement of the region marked in A shows cross sections of t-tubules (B) before and (C) after deconvolution. Image segmentation and correlation led to (D) a mask image and (E) highlighting of tubular structures, respectively.
FIGURE 2
FIGURE 2
Image data and deconvolution. (A) Confocal microscopy of cell with WGA conjugated to an Alexa fluor as a marker of glycocalix polysaccharides shows signal intensities associated with the sarcolemma. Enlargement of the region marked in A displays cross sections of t-tubules (B) before and (C) after deconvolution.
FIGURE 3
FIGURE 3
Coordinate system of image stacks. The myocyte's long axis is parallel to the x axis, and the laser beam with the z axis.
FIGURE 4
FIGURE 4
Visualization of t-system in myocyte based on dextran-fluorescein straining. (A) Cross-sectional image indicates invaginations of the sarcolemma. (B) 3D visualization of cell interior reveals that t-tubules penetrate mostly from bottom and top of the cell. (C) A view from the exterior on the sarcolema indicates that t-tubule ostia are partly regularly organized, but in some regions ostia are missing. (D and E) In part, regions with regularly spaced t-tubules of simple topology are exhibited. (F) An anastomosis forming a longitudinal connection between two t-tubules is shown.
FIGURE 5
FIGURE 5
Electron micrographs of rabbit ventricular myocytes. (A) The cross-sectional image shows t-tubules (t) and their relation to z-disks (z) and myofilaments (myo). The image indicates that t-tubules invaginate the outer sarcolemma and are closely associated to z-disks. (B) The freeze fracture shows two t-tubules (t) connected by an anastomosis (a). Furthermore, the freeze fracture gives indications for constrictions (c) of the t-tubules. (C) A cross-sectional cut through three t-tubules is displayed in relation to z-disks, myofilaments, and mitochondria (mito). The cut through t-tubules indicates noncircular cross sections.
FIGURE 6
FIGURE 6
Visualization and analysis of single t-tubules. (A) A t-tubule and projected dextran-fluorescein signal on xy and xz planes are visualized in 3D. (B) Profiles of raw and background-subtracted cross-sectional integrated signals are shown along the t-tubule. The analysis exhibits two constrictions with reduced signal intensity at 0.5 and 2 μm. (C) The plot displays exemplary background-subtracted profiles with zero, one, and two constrictions.
FIGURE 7
FIGURE 7
Statistical analysis of constrictions in t-tubules (number of cells 6, number of t-tubules: 348, number of constrictions: 170).
FIGURE 8
FIGURE 8
Statistical analysis of (A) cross-sectional flattening and (B) orientation (number of cells: 6, number of cross sections: 5323).
FIGURE 9
FIGURE 9
Visualization of t-system based on (A) dextran-fluorescein and (B) WGA conjugated to an Alexa Fluor. (C) The intensity profiles show that reductions of the dextran-associated signal correlate with reduction in the WGA signal.

References

    1. Cheng, H., M. B. Cannell, and W. J. Lederer. 1994. Propagation of excitation-contraction coupling into ventricular myocytes. Pflugers Arch. 428:415–417. - PubMed
    1. Nelson, D. A., and E. S. Benson. 1963. On the structural continuities of the transverse tubular system of rabbit and human myocardial cells. J. Cell Biol. 16:297–313. - PMC - PubMed
    1. Balijepalli, R. C., J. D. Foell, D. D. Hall, J. W. Hell, and T. J. Kamp. 2006. Localization of cardiac L-type Ca(2+) channels to a caveolar macromolecular signaling complex is required for beta(2)-adrenergic regulation. Proc. Natl. Acad. Sci. USA. 103:7500–7505. - PMC - PubMed
    1. Brette, F., and C. Orchard. 2007. Resurgence of cardiac t-tubule research. Physiology (Bethesda). 22:167–173. - PubMed
    1. Page, E., and L. P. McCallister. 1973. Quantitative electron microscopic description of heart muscle cells. Application to normal, hypertrophied and thyroxin-stimulated hearts. Am. J. Cardiol. 31:172–181. - PubMed

Publication types

MeSH terms

LinkOut - more resources