. 2008 Aug;95(4):1795-812.
doi: 10.1529/biophysj.108.130195. Epub 2008 May 16.

Analysis of phosphatidylinositol-4,5-bisphosphate signaling in cerebellar Purkinje spines

Affiliations

Analysis of phosphatidylinositol-4,5-bisphosphate signaling in cerebellar Purkinje spines

Sherry-Ann Brown et al. Biophys J. 2008 Aug.

Abstract

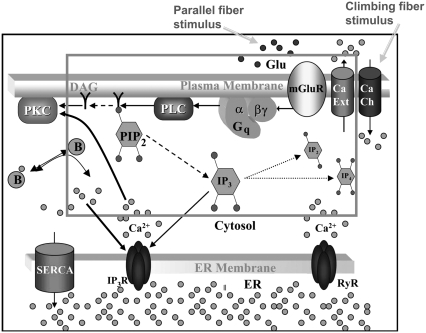
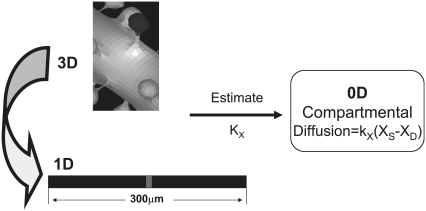
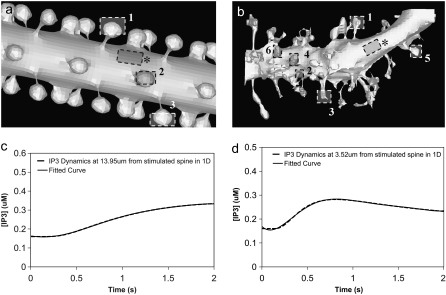
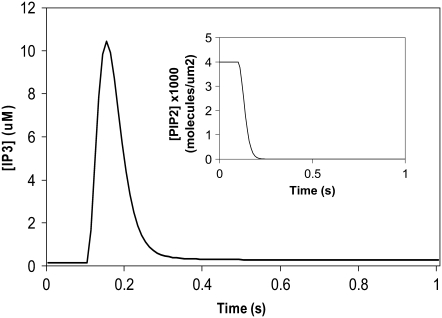
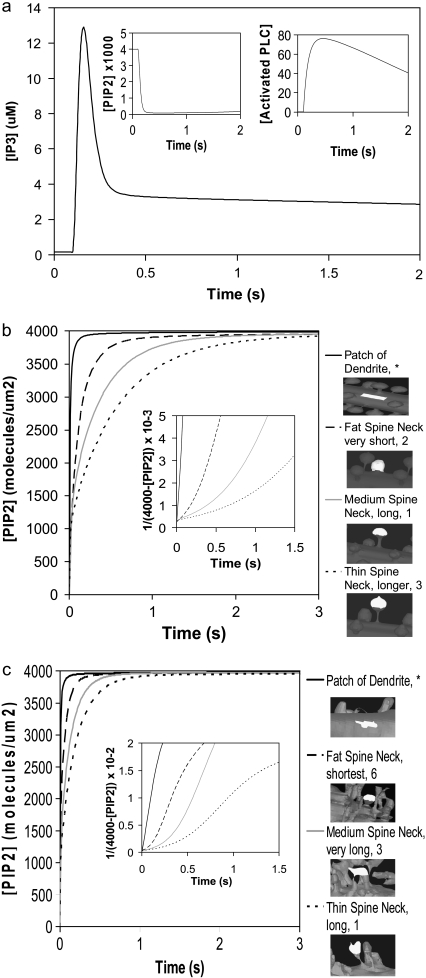
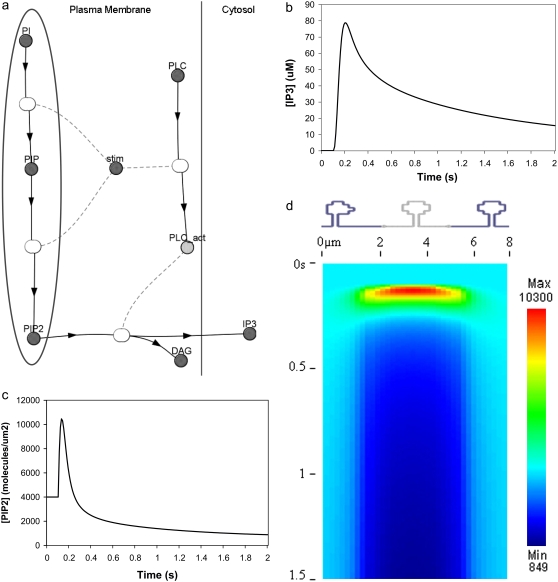
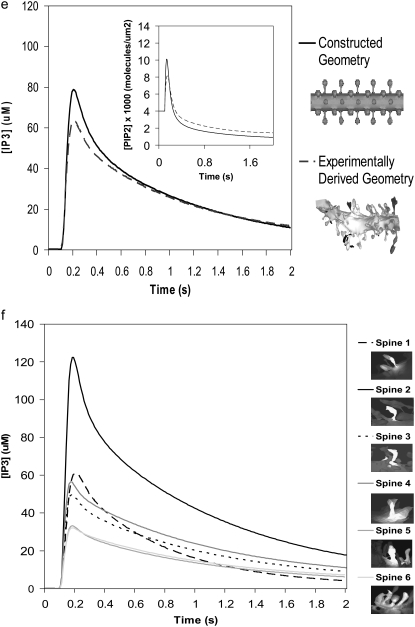
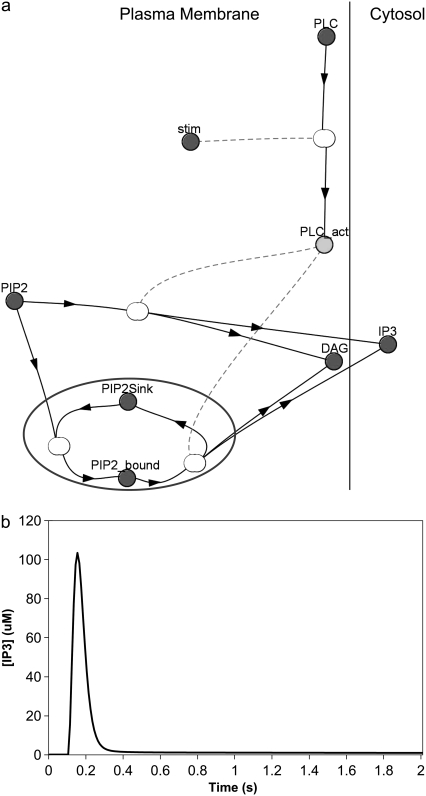
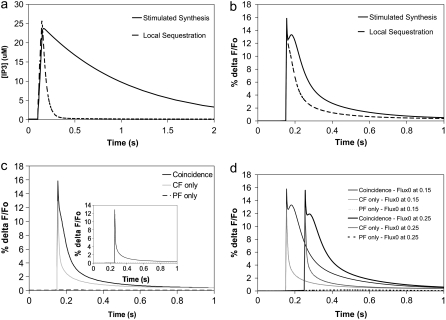
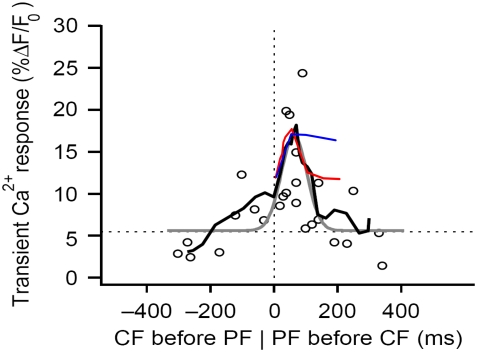
A 3D model was developed and used to explore dynamics of phosphatidylinositol-4,5-bisphosphate (PIP2) signaling in cerebellar Purkinje neurons. Long-term depression in Purkinje neurons depends on coincidence detection of climbing fiber stimulus evoking extracellular calcium flux into the cell and parallel fiber stimulus evoking inositol-1,4,5-trisphosphate (IP3)-meditated calcium release from the endoplasmic reticulum. Experimental evidence shows that large concentrations of IP3 are required for calcium release. This study uses computational analysis to explore how the Purkinje cell provides sufficient PIP2 to produce large amounts of IP3. Results indicate that baseline PIP2 concentration levels in the plasma membrane are inadequate, even if the model allows for PIP2 replenishment by lateral diffusion from neighboring dendrite membrane. Lateral diffusion analysis indicates apparent anomalous diffusion of PIP2 in the spiny dendrite membrane, due to restricted diffusion through spine necks. Stimulated PIP2 synthesis and elevated spine PIP2 mediated by a local sequestering protein were explored as candidate mechanisms to supply sufficient PIP2. Stimulated synthesis can indeed lead to high IP3 amplitude of long duration; local sequestration produces high IP3 amplitude, but of short duration. Simulation results indicate that local sequestration could explain the experimentally observed finely tuned timing between parallel fiber and climbing fiber activation.


Figures

FIGURE 1
FIGURE 1
Membrane and cytoplasmic events involved in parallel fiber-stimulated calcium release in the Purkinje neuron spine. On PF stimulation of the Purkinje neuron spine, the neurotransmitter Glu binds its G-protein coupled glutamatergic metabotropic receptor (mGluR) on the spine surface membrane. formula image separates from its partner formula image and activates the enzyme PLC. PLC cleaves the membrane phospholipid PIP2 to give two products: DAG that remains in the membrane, diffuses away and activates PKC; and IP3 that diffuses away in the cytosol to bind its calcium channel-coupled receptor on the ER membrane. IP3 in the cytoplasm is rapidly degraded to IP2 and IP4. Calcium is released from ER stores into the cytoplasm and also activates PKC. Calcium in the cytoplasm is sequestered and dissociated from various buffers (B). Some calcium is pumped back into the ER by SARCO/endoplasmic reticulum calcium-ATPase (SERCA) on the ER membrane. Some of the remaining calcium is pumped out of the cell by a calcium exchanger; calcium also may enter the cell via a calcium channel. The highlighted rectangular area roughly encloses the portion of the diagram included in the 1D and 3D Virtual Cell models described in this study: cleavage of PIP2 to form IP3 and DAG on stimulation of the Purkinje neuron spine by PF via the neurotransmitter glutamate. The compartmental model in this study then examines the consequences of the patterns of IP3 on the ability of the spine to generate a calcium response.
FIGURE 2
FIGURE 2
Relationships between 3D, 1D, and 0D models. 3D models consider diffusion in all regions, including on the membrane surface, explicitly. In a 1D geometry (straight line), diffusion down the dendrite can be modeled explicitly within a long linear geometry and diffusion between spine and dendrite is modeled implicitly according to Eq. 1. Various segments of the straight line in 1D can be designated by x coordinates to span a single activated spino-dendritic unit, highlighted in gray in the center of the straight line. The 0D (compartmental) model uses ordinary differential equations to mathematically describe a single spino-dendritic unit where the geometries are taken into account by considering the relative volumes and surface to volume ratios of the spine and dendrite compartments. Again, the diffusion of species between spine and dendrite must be modeled by Eq. 1 and an additional term is also included for the decay of the dendritic species due to the equilibration between the region just under the activated spine and the steady state concentration further way in the dendritic shaft (see Hernjak et al. (22) for full details of the structure of the compartmental model).
FIGURE 3
FIGURE 3
3D Purkinje dendrite geometries and the derivation of boundary conditions. (a) Constructed geometry with spines that have uniformly spherical heads and narrow, wide, and medium-sized necks; created using values for spine parameters that fall within ranges obtained from Harris and Stevens (29). The dendrite branchlet is 20 μm long and 2 μm in diameter. Spine 1 is used for most of the simulations. Spines 2 and 3 and the patch of dendrite (*) are used in the PIP2 lateral diffusion studies. (b) Experimentally derived geometry with spines of various shapes and sizes that have narrow, wide, and medium-sized necks; reconstructed in Virtual Cell from a 3D stack of electron microscope images courtesy of Maryanne Martone, Mark Ellisman, and Masako Terada of the National Center for Microscopy and Imaging Research (San Diego, CA). Spine 1 is used in most of the simulations with the experimentally derived geometry. Spines 3 and 6 are used in the PIP2 lateral diffusion studies; and spines 2, 4, and 5 are also stimulated in the stimulated PIP2 synthesis model. (c) IP3 concentration time course at 13.95 μm from the stimulated spine in the 1D model that is used to set a time-varying boundary condition for the constructed 3D geometry (13.95 μm represents the edge of the geometry relative to the stimulated spine at the center of the geometry). The central spine is excited 12 times in succession beginning at t = 0.1 s. Each excitation follows the last by formula image = 0.012 s. A fitted curve with equation y = −3E-14x6 + 2E-11x5 − 4E-09x4 + 3E-07x3 + 6E-06x2 − 0.0003x + 0.1618 is superimposed on the simulation results. (d) IP3 concentration at ∼3.52 μm from the stimulated spine in the 1D model that is used to set a time-varying boundary condition for the 3D geometry (3.52 μm represents the edge of the geometry relative to the stimulated spine at the center of the geometry). The central spine is excited 12 times in succession beginning at t = 0.1 s. Each excitation follows the last by formula image = 0.012 s. A fitted curve with equation y = 2E-13x6 − 2E-10x5 + 4E-08x4 − 5E-06x3 + 0.0003x2 − 0.0047x + 0.1744 is superimposed on the simulation results.
FIGURE 4
FIGURE 4
IP3 concentration in constructed 3D geometry for central spine stimulated 12 times in succession beginning at t = 0.1 s. IP3 concentration results from cleavage of PIP2, which is rapidly depleted. Each excitation follows the last by formula image = 0.012 s. (Inset) Corresponding PIP2 concentration at central spine in constructed 3D geometry. The results show that calculated basal levels of PIP2 in the Purkinje neuron spine membrane (4000 mol/μm2) are not sufficient to produce large amounts of IP3.
FIGURE 5
FIGURE 5
(a) IP3 concentration for central spine stimulated 12 times at the central spine in constructed 3D geometry as in Fig. 4, but allowing for lateral diffusion of PIP2. (Inset) Corresponding PIP2 and activated PLC concentrations. Recovery of PIP2 in the presence of lateral diffusion begins soon after depletion. (b) PIP2 diffusion for spine necks of varying diameter and length in our 3D model using the constructed geometry (Fig. 3 a, spines 1–3). PIP2 was depleted instantaneously in a patch of dendrite membrane and portions of spine heads. PIP2 laterally diffused into the patch of dendrite and into the spine heads at different rates. The pattern of diffusion varies with the geometry of the spine necks. The PIP2 concentration in the patch of dendrite and in the spine heads recovers to an equilibrium value of 4000 mol/μm2. (Inset) Analysis of PIP2 diffusion in constructed geometry. For simple diffusion, time ∝ 1/(4000-[PIP2]), where 4000 mol/μm2 is the surface density of PIP2 at t = ∞. The patch of dendrite yields a straight line indicating simple diffusion, whereas each spine gives a different curve, but not a straight line, indicating apparent anomalous diffusion. (c) PIP2 diffusion with time for spine necks of varying diameter and length in our 3D model using the experimentally derived geometry (Fig. 3 b, spines 1, 3, 6). PIP2 was instantaneously depleted in a patch of dendrite and portions of spine heads and the patterns of recovery are similar to those observed for the idealized geometry of Fig. 3 a. (Inset) Analysis of PIP2 diffusion in the experimental geometry, as in b.
FIGURE 6
FIGURE 6
(a) Virtual Cell Reaction scheme for activation of PLC, cleavage of PIP2, and stimulated synthesis of PIP2 via phosphorylation of its precursors. The gray oval encloses the section of the reaction scheme representing stimulated PIP2 synthesis. The dark shaded circles represent species or variables and the lightly shaded ovals represent reactions; in the Virtual Cell software; doubleclicking a shaded oval shows an editable reaction rate law. The variable stim is set to an expression in the spatial coordinates that localizes PLC activation and stimulated PIP2 synthesis to a single spine in the 1D and 3D geometries. PI is converted to PIP and PIP is converted to PIP2. A species with an arrow going away from it is described as a reactant; a species with an arrow coming toward it is described as a product; a species with dotted lines is considered a modifier that is not depleted or created during the course of the reaction (e.g., a catalyst or a variable such as stim that serves to localize a reaction). (b) IP3 concentration for central spine stimulated 12 times at 80 Hz beginning at t = 0.1 s, with both stimulated PIP2 synthesis and lateral diffusion of PIP2 added to the model using the constructed 3D geometry. The large IP3 concentration results from cleavage of high amounts of PIP2 produced by stimulated synthesis. (c and d) Corresponding PIP2 concentration at the central spine in the constructed 3D geometry. The results show that stimulated PIP2 synthesis with a small contribution from PIP2 lateral diffusion produces a transient increase in PIP2 concentration before depletion. The kymograph (d), spanning a distance of 8 μm along the Purkinje dendrite flanking the stimulated spine, illustrates that the PIP2 concentration peaks in the stimulated central spine before depletion and stays relatively constant in the adjacent dendrite. (e) Comparison of IP3 concentration curves for stimulated PIP2 synthesis in the central spine in the constructed and the experimentally derived 3D geometries. (Inset) Corresponding PIP2 concentrations for stimulated synthesis and lateral diffusion in the central spine in both the constructed and the experimentally derived 3D geometries. Both geometries give similar curves. (f) IP3 concentration for several spines in experimentally derived 3D geometry stimulated as above. Each IP3 concentration curve corresponds to a unique spine in the experimentally derived geometry. Variations in IP3 concentration exhibited for each spine is solely due to the geometry of the spine; ∼80% of each spine head was stimulated.
FIGURE 6
FIGURE 6
(a) Virtual Cell Reaction scheme for activation of PLC, cleavage of PIP2, and stimulated synthesis of PIP2 via phosphorylation of its precursors. The gray oval encloses the section of the reaction scheme representing stimulated PIP2 synthesis. The dark shaded circles represent species or variables and the lightly shaded ovals represent reactions; in the Virtual Cell software; doubleclicking a shaded oval shows an editable reaction rate law. The variable stim is set to an expression in the spatial coordinates that localizes PLC activation and stimulated PIP2 synthesis to a single spine in the 1D and 3D geometries. PI is converted to PIP and PIP is converted to PIP2. A species with an arrow going away from it is described as a reactant; a species with an arrow coming toward it is described as a product; a species with dotted lines is considered a modifier that is not depleted or created during the course of the reaction (e.g., a catalyst or a variable such as stim that serves to localize a reaction). (b) IP3 concentration for central spine stimulated 12 times at 80 Hz beginning at t = 0.1 s, with both stimulated PIP2 synthesis and lateral diffusion of PIP2 added to the model using the constructed 3D geometry. The large IP3 concentration results from cleavage of high amounts of PIP2 produced by stimulated synthesis. (c and d) Corresponding PIP2 concentration at the central spine in the constructed 3D geometry. The results show that stimulated PIP2 synthesis with a small contribution from PIP2 lateral diffusion produces a transient increase in PIP2 concentration before depletion. The kymograph (d), spanning a distance of 8 μm along the Purkinje dendrite flanking the stimulated spine, illustrates that the PIP2 concentration peaks in the stimulated central spine before depletion and stays relatively constant in the adjacent dendrite. (e) Comparison of IP3 concentration curves for stimulated PIP2 synthesis in the central spine in the constructed and the experimentally derived 3D geometries. (Inset) Corresponding PIP2 concentrations for stimulated synthesis and lateral diffusion in the central spine in both the constructed and the experimentally derived 3D geometries. Both geometries give similar curves. (f) IP3 concentration for several spines in experimentally derived 3D geometry stimulated as above. Each IP3 concentration curve corresponds to a unique spine in the experimentally derived geometry. Variations in IP3 concentration exhibited for each spine is solely due to the geometry of the spine; ∼80% of each spine head was stimulated.
FIGURE 7
FIGURE 7
(a) Virtual Cell Reaction scheme for activation of PLC, cleavage of bound and unbound PIP2, and local sequestration of PIP2 by a binding protein or “sink”. The gray circle encloses the section of the reaction scheme representing local sequestration. PLC is allowed to cleave free PIP2 as well as PIP2 bound to the “sink” protein or complex. Other details are similar to Fig. 6 a. (b) IP3 concentration for central spine stimulated 12 times at 80 Hz beginning at t = 0.1 s, with local sequestration of PIP2 added to the model using the constructed 3D geometry. The IP3 concentration results from cleavage of both free PIP2 and PIP2 bound to a binding protein or “sink”.
FIGURE 8
FIGURE 8
(a) IP3 concentration for 4 PF stimuli at 80 Hz beginning at t = 0.1 s in the adapted compartmental model. The parameters were chosen to fit the spine IP3 dynamics for local PIP2 sequestration (dashed curve) and stimulated PIP2 synthesis (solid curve) in our 3D model using the constructed geometry. Local sequestration and stimulated synthesis are able to produce similar amplitudes of IP3, but with different durations. (b) Ca transients for coincident activation of Purkinje neuron spine by 4 PF stimuli beginning at t = 0.1 s and 1 CF stimulus at 0.15 s in the adapted compartmental models produced by parameters corresponding to local PIP2 sequestration (dashed curve) and stimulated PIP2 synthesis (solid curve). (c) Ca transients for 4 PF stimuli only (dashed line), 1 CF stimulus only (shaded line), or coincident activation by 4 PF stimuli and 1 CF stimulus (solid line) in the adapted compartmental model with parameters corresponding to local PIP2 sequestration. The train of 4 PF stimuli begins at 0.1 s; the CF stimulus occurs at 0.15 s. (Inset) As above, but with calcium influx at 0.25 s. (d) Timing dependence for the stimulated synthesis mechanism. Ca transients for 4 PF stimuli only (partially dashed line), 1 CF stimulus only (lightly shaded line), or coincident activation by 4 PF stimuli and 1 CF stimulus (solid line). The train of 4 PF stimuli begins at 0.1 s; the CF stimulus occurs at 0.15 s for the curves on the left and at 0.25 s for the curves on the right.
FIGURE 9
FIGURE 9
Comparing simulation results to experimental data for spine coincidence detection. Peak calcium transient patterns from the adapted compartmental model produced by parameters corresponding to stimulated PIP2 synthesis (blue) and local PIP2 sequestration (red) are superimposed on the peak calcium transient pattern published by Wang et al. (25) based on their experimental results (black) (adapted by permission from Macmillan Publishers: Nature Neuroscience (25), copyright 2000). The peak calcium transient refers to the amplitude of the calcium transient obtained from coincident activation by 4 PF stimuli and 1 CF stimulus. Timing, on the horizontal axis, is calculated as Time of CF stimulus − Time of initial PF stimulus. The curves show that local PIP2 sequestration provides a peak calcium transient pattern that qualitatively fits the experimental results.

References

    1. McLaughlin, S., J. Wang, A. Gambhir, and D. Murray. 2002. PIP(2) and proteins: interactions, organization, and information flow. Annu. Rev. Biophys. Biomol. Struct. 31:151–175. - PubMed
    1. Sun, Y., K. Ling, M. P. Wagoner, and R. A. Anderson. 2007. Type I gamma phosphatidylinositol phosphate kinase is required for EGF-stimulated directional cell migration. J. Cell Biol. 178:297–308. - PMC - PubMed
    1. Oude Weernink, P. A., M. López de Jesús, and M. Schmidt. 2007. Phospholipase D signaling: orchestration by PIP2 and small GTPases. Naunyn Schmiedebergs Arch. Pharmacol. 374:399–411. - PMC - PubMed
    1. Logan, M. R., and C. A. Mandato. 2006. Regulation of the actin cytoskeleton by PIP2 in cytokinesis. Biol. Cell. 98:377–388. - PubMed
    1. Wenk, M. R., L. Pellegrini, V. A. Klenchin, G. Di Paolo, S. Chang, L. Daniell, M. Arioka, T. F. Martin, and P. De Camilli. 2001. PIP kinase Iγ is the major PI(4,5)P2 synthesizing enzyme at the synapse. Neuron. 32:79–88. - PubMed

Publication types

MeSH terms

Substances