. 2008 Aug;95(4):1729-44.
doi: 10.1529/biophysj.108.130658. Epub 2008 May 16.

Molecular dynamics simulation of Kv channel voltage sensor helix in a lipid membrane with applied electric field

Affiliations

Molecular dynamics simulation of Kv channel voltage sensor helix in a lipid membrane with applied electric field

Manami Nishizawa et al. Biophys J. 2008 Aug.

Abstract

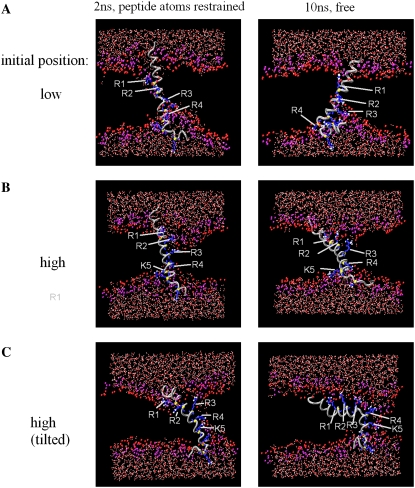
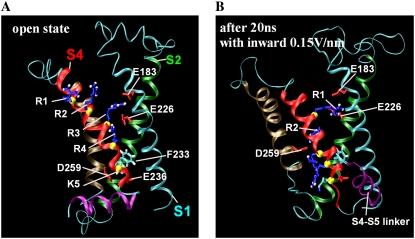
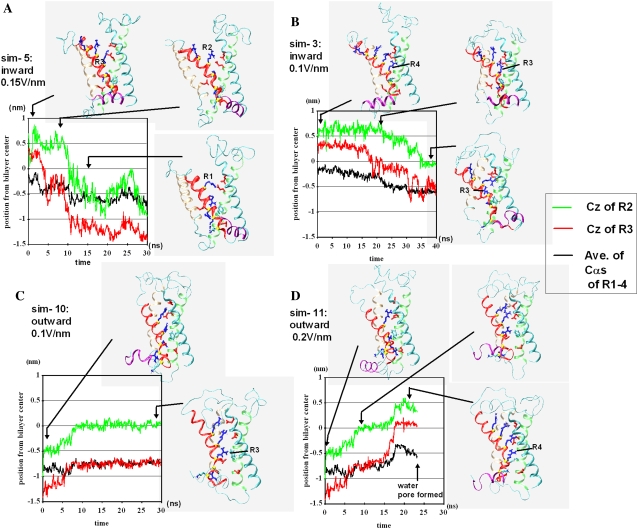
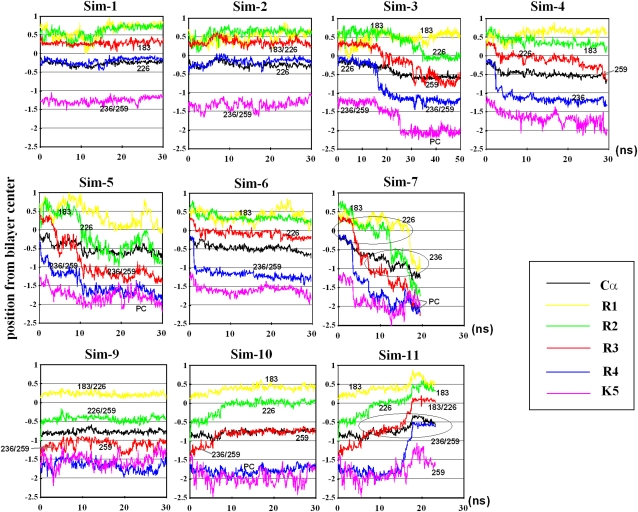
In this article, we present the results of the molecular dynamics simulations of amphiphilic helix peptides of 13 amino-acid residues, placed at the lipid-water interface of dipalmitoylphosphatidylcholine bilayers. The peptides are identical with, or are derivatives of, the N-terminal segment of the S4 helix of voltage-dependent K channel KvAP, containing four voltage-sensing arginine residues (R1-R4). Upon changing the direction of the externally applied electric field, the tilt angle of the wild-type peptide changes relative to the lipid-water interface, with the N-terminus heading up with an outward electric field. These movements were not observed using an octane membrane in place of the dipalmitoylphosphatidylcholine membrane, and were markedly suppressed by 1), substituting Phe located one residue before the first arginine (R1) with a hydrophilic residue (Ser, Thr); or 2), changing the periodicity rule of Rs from at-every-third to at-every-fourth position; or 3), replacing R1 with a lysine residue (K). These and other findings suggest that the voltage-dependent movement requires deep positioning of Rs when the resting (inward) electric field is present. Later, we performed simulations of the voltage sensor domain (S1-S4) of Kv1.2 channel. In simulations with a strong electric field (0.1 V/nm or above) and positional restraints on the S1 and S2 helices, S4 movement was observed consisting of displacement along the S4 helix axis and a screwlike axial rotation. Gating-charge-carrying Rs were observed to make serial interactions with E183 in S1 and E226 in S2, in the outer water crevice. A 30-ns-backward simulation started from the open-state model gave rise to a structure similar to the recent resting-state model, with S4 moving vertically approximately 6.7 A. The energy landscape around the movement of S4 appears very ragged due to salt bridges formed between gating-charge-carrying residues and negatively charged residues of S1, S2, and S3 helices. Overall, features of S3 and S4 movements are consistent with the recent helical-screw model. Both forward and backward simulations show the presence of at least two stable intermediate structures in which R2 and R3 form salt bridges with E183 or E226, respectively. These structures are the candidates for the states postulated in previous gating kinetic models, such as the Zagotta-Hoshi-Aldrich model, to account for more than one transition step per subunit for activation.


Figures

FIGURE 1
FIGURE 1
The z distance of each Cα in the 13aa α-helix peptides from the DPPC bilayer (top three lines) and octane (bottom) midplane. For LFR (top, left) and LFK (third line), one representative trajectory out of five 10-ns simulations was analyzed. For the other peptides, one out of three runs was analyzed. Shown is the position averaged from 20 frames covering the final 2-ns period of the simulation. Error bars show the mean ± SD for the 20 frames. Shaded lines show the results with the inward (resting) electric field. Dark lines show the results with the outward (depolarizing) electric field. Symbols shown in the left part of each graph show the mean z position of the center of mass of the carbonyl oxygen atoms (COs) in the outer membrane leaflet in simulations performed with an inward electric field (circle) and an outward electric field (solid triangle). The leftmost symbols indicate the center of mass of the COs at least 0.7 nm away from any atoms in the peptide, whereas the symbols just to the right of them indicate the com of COs located within 0.7 nm of any atoms in the peptide. For the peptide/octane system (bottom), the mean ± SD was negligibly small (<∼0.1 nm), and so omitted.
FIGURE 2
FIGURE 2
Snapshot of LFR/DPPC. Shown are frames at 10 ns of the simulation with the inward (A) and the outward (B) electric field. For clarity, Phe2 and four Rs are shown in licorice representation. Green ribbon shows the backbone of the LFR peptide, whereas yellow spheres show the Cα-values of R1–R4.
FIGURE 3
FIGURE 3
Snapshots of S4 simulations. (A) Simulation with S4 initially placed at a low position. The center of mass (or com) of R1–R4 Cα-values was placed −0.029 A above the bilayer center. (B) Simulation with S4 initially placed at a high position. The com was placed 4.5 Å above the bilayer center. (C) Simulation with S4 initially placed at a high position and tilted. The com was placed 4.2 Å above the bilayer center and the τ-angle was set at 43° to mimic the x-ray structure reported by Long et al. (5). For each of panels AC, left snapshot is the frame at 2 ns of simulation with the positional restraints on all atoms of S4 helix. Right snapshot is the frame obtained 10 ns after the restraints were removed. The peptide backbone is shown with a silver tube. Red spheres, ester oxygen atoms; purple spheres, phosphate oxygen atoms.
FIGURE 4
FIGURE 4
Conformation changes observed in simulation-5 (sim-5). (A) Snapshot after 1 ns of the simulation without the electric field. (B) Snapshot after 20 ns of the simulation in the presence of the inward electric field at 0.15 V/nm (see Table 2).
FIGURE 5
FIGURE 5
Time course of the z position for the side chain of R2 and of R3, and the average Cα-value z positions of R1–R4. Green and red lines represent the positions of Cz, the carbon atom closest to the charged nitrogen atoms, of R2 and R3, respectively. Black lines show the average Cα-values z positions of R1–R4. (A) sim-5, (B) sim-3, (C) sim-10, and (D) sim-11.
FIGURE 6
FIGURE 6
Time course of the z position for the side chain of R1–R4 and K5 and the average Cα-value z positions of R1–R4. Shown are the results for all the simulations listed in Table 2. Yellow, green, red, and blue lines indicate the z positions of the Cz of R1, R2, R3, and R4, respectively, and the magenta line indicates that of the Nz of K5. Black lines show the average of Cα-value z positions of R1–R4. The numbers drawn in the graphs show the residues with which R1–R4 and K5 form salt bridges: 183 is E183; 226 is E226; 236 is E236; and 259 is D259. PC denotes the DPPC headgroup.

References

    1. Hille, B. 2001. Ion Channels of Excitable Membranes, 3rd Ed. Sinauer, Sunderland, MA.
    1. Jan, L. Y., and Y. N. Jan. 1997. Voltage-gated and inwardly rectifying potassium channels. J. Physiol. 505:267–282. - PMC - PubMed
    1. Li-Smerin, Y., and K. J. Swartz. 1998. Gating modifier toxins reveal a conserved structural motif in voltage-gated Ca2+ and K+ channels. Proc. Natl. Acad. Sci. USA. 95:8585–8589. - PMC - PubMed
    1. Jiang, Y., A. Lee, J. Chen, V. Ruta, M. Cadene, B. T. Chait, and R. MacKinnon. 2003. X-ray structure of a voltage-dependent K+ channel. Nature. 423:33–41. - PubMed
    1. Long, S. B., E. B. Campbell, and R. Mackinnon. 2005. Crystal structure of a mammalian voltage-dependent Shaker family K+ channel. Science. 309:897–903. - PubMed

MeSH terms

Substances

LinkOut - more resources