. 2008 Jul;74(14):4463-71.
doi: 10.1128/AEM.00710-08. Epub 2008 May 16.

Localized gene expression in Pseudomonas aeruginosa biofilms

Affiliations

Localized gene expression in Pseudomonas aeruginosa biofilms

Ailyn P Lenz et al. Appl Environ Microbiol. 2008 Jul.

Abstract

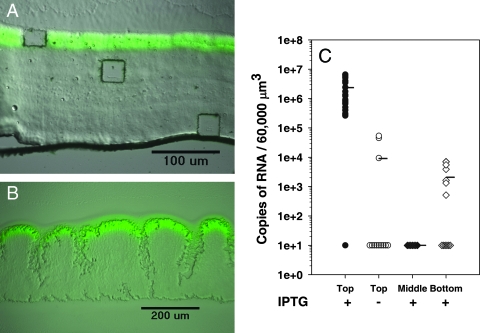
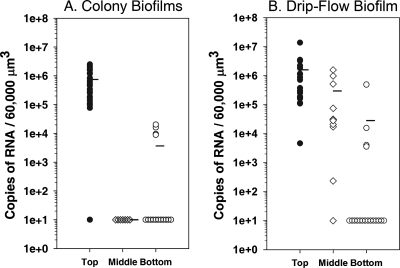
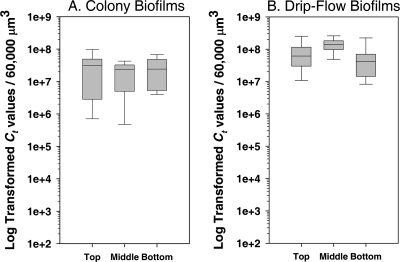
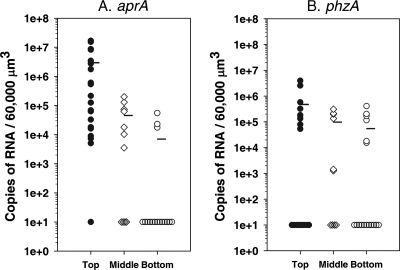
Gene expression in biofilms is dependent on bacterial responses to the local environmental conditions. Most techniques for studying bacterial gene expression in biofilms characterize average values across the entire population. Here, we describe the use of laser capture microdissection microscopy (LCMM) combined with multiplex quantitative real-time reverse transcriptase PCR (qRT-PCR) to isolate and quantify RNA transcripts from small groups of cells at spatially resolved sites within biofilms. The approach was first tested and analytical parameters were determined for Pseudomonas aeruginosa containing an isopropyl-beta-D-thiogalactopyranoside-inducible gene for the green fluorescent protein (gfp). The results show that the amounts of gfp mRNA were greatest in the top zones of the biofilms, and that gfp mRNA levels correlated with the zone of active green fluorescent protein fluorescence. The method then was used to quantify transcripts from wild-type P. aeruginosa biofilms for a housekeeping gene, acpP; the 16S rRNA; and two genes regulated by quorum sensing, phzA1 and aprA. The results demonstrated that the amount of acpP mRNA was greatest in the top 30 microm of the biofilm, with little or no mRNA for this gene at the base of the biofilms. In contrast, 16S rRNA amounts were relatively uniform throughout biofilm strata. Using this strategy, the RNA amounts of individual genes were determined, and therefore the results are dependent on both gene expression and the half-life of the transcripts. Therefore, the uniform amount of rRNA throughout the biofilms likely is due to the stability of the rRNA within ribosomes. The levels of aprA mRNA showed stratification, with the largest amounts in the upper 30-microm zone of these biofilms. The results demonstrate that mRNA levels for individual genes are not uniformly distributed throughout biofilms but may vary by orders of magnitude over small distances. The LCMM/qRT-PCR technique can be used to resolve and quantify this RNA variability at high spatial resolution.


Figures

FIG. 1.
FIG. 1.
Localized GFP fluorescence of (A) biofilm cultivated in a drip-flow reactor and (B) colony biofilm. Biofilms were incubated without an inducing agent for 72 and 52 h, respectively, and then were induced with 1 mM IPTG for the final 4 h. (B) LCMM was used to obtain microdissected samples from regions within the biofilm ranging from 500 to 60,000 μm2. (C) qRT-PCR of gfp mRNA obtained from the top fluorescent zone of the IPTG-induced biofilms (n = 26) and from the equivalent top zone of the noninduced biofilms (n = 12). Sections were normalized to 60,000 μm3 for comparison. Each point represents an individual measurement. The points plotted at 101 are below detection limits (+IPTG, 1 sample; −IPTG, 9 samples). A two-tailed Mann-Whitney test to calculate differences in means between IPTG-induced and noninduced biofilms was used (P < 0.01). The LCMM also was used to obtain biofilm sections from the middle (n = 7) and bottom (n = 13) of the biofilm. A value of 101 indicates amounts below the level of detection (middle, 7 samples; bottom, 6 samples).
FIG. 2.
FIG. 2.
Stratified expression of acpP mRNA in biofilms. qRT-PCR was performed on acpP obtained from the top (n = 26 and 21), middle (n = 8 and 11), or bottom (n = 15 and 18) of colony biofilms and drip-flow biofilms, respectively. Two-tailed Mann-Whitney test results demonstrated significant differences in acpP expression (P < 0.01 for values for the top layer compared to those for the middle or bottom layer). The number of samples below the level of detection are shown as 101 for colony biofilms (top, 1 sample; middle, 8 samples; bottom, 11 samples) and drip-flow biofilms (top, 0 samples; middle, 1 sample; bottom, 14 samples).
FIG. 3.
FIG. 3.
Box plot of 16S rRNA in biofilms. Sections from the top (n = 10 and 12), middle (n = 11 and 8), and bottom (n = 12 and 17) biofilm layers from colony biofilms or drip-flow biofilms, respectively, were analyzed by SYBR green-based qRT-PCR. CTs were log transformed and adjusted to 60,000 μm3. The line indicates the median; 50% of observations are within the box. Bars indicate samples with the minimum and maximum values. A two-tailed Mann-Whitney test for comparisons between top and bottom levels of 16S rRNA in colony biofilms showed no significant differences (P > 0.5). In addition, no significant difference was observed for the different layers of the drip-flow biofilms.
FIG. 4.
FIG. 4.
Expression of QS-regulated genes aprA and phzA1 in P. aeruginosa PAO1 biofilms that were cultivated in drip-flow reactors. (A) aprA mRNA obtained from the top (n = 20), middle (n = 11), and bottom (n = 17) of biofilms. The mRNA levels in some samples were below the level of detection (top, 1 sample; middle, 4 samples; bottom, 13 samples). (B) phzA1 mRNA from the same samples. The mRNA levels in some samples were below the level of detection (top, 8 samples; middle, 4 samples; bottom, 11 samples). Two-tailed Mann-Whitney test results demonstrated significant differences in aprA expression (P < 0.01 for values for the top layer compared to those for the middle or bottom layer). Two-tailed Mann-Whitney test results demonstrated no significant differences in phzA expression (P > 0.1 for values for the top layer compared to those for the middle or bottom layer).
FIG. 5.
FIG. 5.
Limits of detection for microdissected biofilm samples and for planktonic cultures for gfp (A), acpP (B), and 16S rRNA (C). Detection limits were based on biofilm volume using 5-μm-thick sections of the top zones of the biofilms. Detection limits for planktonic cells were based on the numbers of CFU of serially diluted cultures. Dual-labeled probes were used in multiplex reactions for gfp (r2 = 0.89 for biofilm cells and r2 = 0.99 for planktonic cells) and for acpP (r2 = 0.94 for biofilm cells and r2 = 0.99 for planktonic cells). The levels of 16S rRNA were measured using the SYBR green-based chemistry of qRT-PCR (r2 = 0.87 for biofilm and r2 = 0.99 for planktonic).

References

    1. Amann, R. I. 1995. Fluorescently labelled, rRNA-targeted oligonucleotide probes in the study of microbial ecology. Mol. Ecol. 4:543-554.
    1. An, D., and M. R. Parsek. 2007. The promise and peril of transcriptional profiling in biofilm communities. Curr. Opin. Microbiol. 10:292-296. - PubMed
    1. Anderl, J. N., M. J. Franklin, and P. S. Stewart. 2000. Role of antibiotic penetration limitation in Klebsiella pneumoniae biofilm resistance to ampicillin and ciprofloxacin. Antimicrob. Agents Chemother. 44:1818-1824. - PMC - PubMed
    1. Bagge, N., M. Schuster, M. Hentzer, O. Ciofu, M. Givskov, E. P. Greenberg, and N. Hoiby. 2004. Pseudomonas aeruginosa biofilms exposed to imipenem exhibit changes in global gene expression and beta-lactamase and alginate production. Antimicrob. Agents Chemother. 48:1175-1187. - PMC - PubMed
    1. Barton, H. A., Z. Johnson, C. D. Cox, A. I. Vasil, and M. L. Vasil. 1996. Ferric uptake regulator mutants of Pseudomonas aeruginosa with distinct alterations in the iron-dependent repression of exotoxin A and siderophores in aerobic and microaerobic environments. Mol. Microbiol. 21:1001-1017. - PubMed

Publication types

MeSH terms

LinkOut - more resources