. 2008 Aug;18(8):1224-37.
doi: 10.1101/gr.075804.107. Epub 2008 May 16.

A genomic analysis of RNA polymerase II modification and chromatin architecture related to 3' end RNA polyadenylation

Affiliations

A genomic analysis of RNA polymerase II modification and chromatin architecture related to 3' end RNA polyadenylation

Zheng Lian et al. Genome Res. 2008 Aug.

Abstract

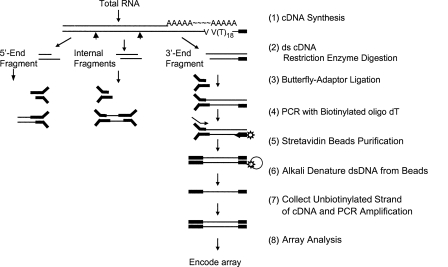
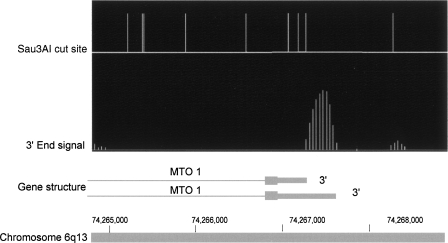
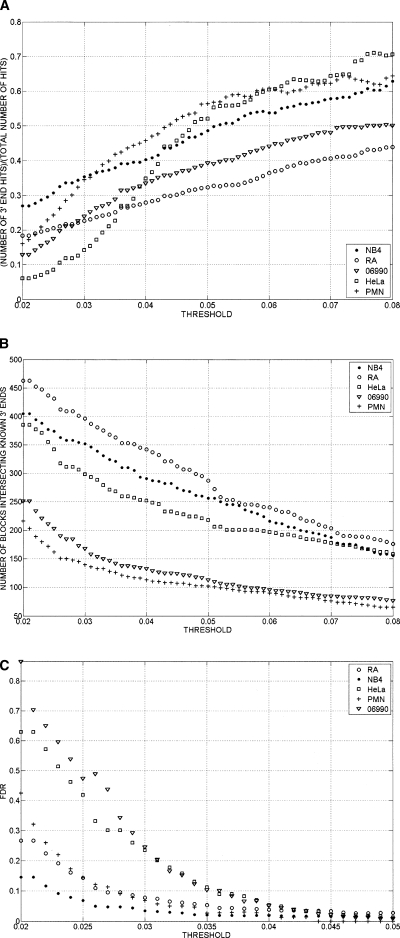
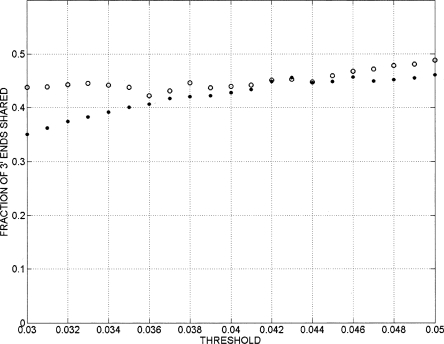
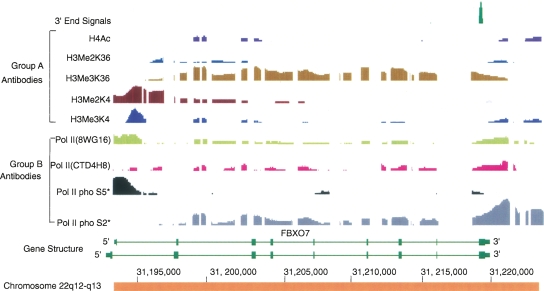
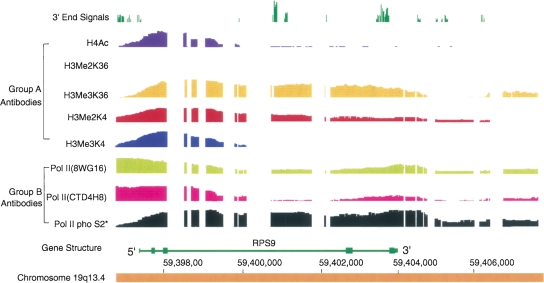
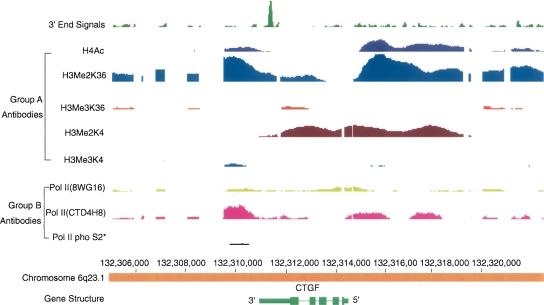
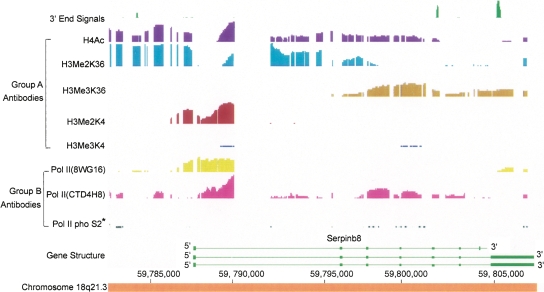
Genomic analyses have been applied extensively to analyze the process of transcription initiation in mammalian cells, but less to transcript 3' end formation and transcription termination. We used a novel approach to prepare 3' end fragments from polyadenylated RNA, and mapped the position of the poly(A) addition site using oligonucleotide arrays tiling 1% of the human genome. This approach revealed more 3' ends than had been annotated. The distribution of these ends relative to RNA polymerase II (PolII) and di- and trimethylated lysine 4 and lysine 36 of histone H3 was compared. A substantial fraction of unannotated 3' ends of RNA are intronic and antisense to the embedding gene. Poly(A) ends of annotated messages lie on average 2 kb upstream of the end of PolII binding (termination). Near the termination sites, and in some internal sites, unphosphorylated and C-terminal domain (CTD) serine 2 phosphorylated PolII (POLR2A) accumulate, suggesting pausing of the polymerase and perhaps dephosphorylation prior to release. Lysine 36 trimethylation occurs across transcribed genes, sometimes alternating with stretches of DNA in which lysine 36 dimethylation is more prominent. Lysine 36 methylation decreases at or near the site of polyadenylation, sometimes disappearing before disappearance of phosphorylated RNA PolII or release of PolII from DNA. Our results suggest that transcription termination loss of histone 3 lysine 36 methylation and later release of RNA polymerase. The latter is often associated with polymerase pausing. Overall, our study reveals extensive sites of poly(A) addition and provides insights into the events that occur during 3' end formation.


Figures

Figure 1.
Figure 1.
Schematic of the procedure used for preparation of 3′ end fragments from cDNA. The thin black bars indicate the positions of cDNA sequences, and the Y-shaped solid black bars show the butterfly adapters.
Figure 2.
Figure 2.
Example of poly(A) signal. Vertical lines in the top portion of the figure correspond to Sau3AI recognition sites in genomic DNA. Closely spaced vertical lines in the second row represent the normalized signals comparing 3′ end fragments to total cDNA. The lower horizontal line represents the 3′ end of the MTO1 gene. Thick bars are exons and thin lines are introns. The figure shows that the orientation of the transcript can be distinguished because the signal begins at a Sau3AI cutting site and extends part way toward the next cutting site. This shows that the major 3′ end of the MTO1 transcript in these HeLa cells is coincident with the shorter 3′ end in the literature, with a very weak second signal corresponding to the longer 3′ end. Note that computer smoothing of data causes some signal spread upstream of the cutting site.
Figure 3.
Figure 3.
(A) Ratio of 3′ end signals for annotated genes to total 3′ end signals as a function of the threshold value used to call 3′ ends. After quantile normalization, data from replicates were combined by averaging the signals of the replicates. Signal intensity yi = log(Ri) − log(Gi) was assigned to each probe, where log(Ri) and log(Gi) are Cy5 and Cy3 channels’ intensities after the aforementioned transformations were performed. Contiguous segments (bars) due to the signal coming from the enriched regions were obtained by joining probes with intensities yi above the threshold separated by less than a certain distance (max-gap of 114 bp). Only segments whose length was greater than a particular size (min-run of 114 bp) were selected. As the threshold for calling a positive signal was lowered, a greater fraction of the calls were from regions not adjacent to the 3′ ends of known genes. Results are shown for five cell types. GENCODE annotation was used for the analysis. (B) Total number of 3′ end signals associated with annotated genes as a function of threshold. Signals are considered as intersecting a known 3′ end if they lie within 2500 bases downstream from the known end. Signals were calculated as in A. The number of signals associated with known genes increased throughout the range as thresholds were lowered. Results are shown for five cell types. 06990 and PMN are end stage differentiated cells (a lymphoblastoid cell and a normal neutrophil); therefore, it is not surprising to see that a smaller number of 3′ ends are present in these cell lines. GENCODE annotation was used for the analysis. (C) False-discovery rate (FDR) as a function of the threshold used to call 3′ ends. Results are shown for five cell types. For each data set the genomic locations of the probes on the microarray were randomly shuffled. The max-gap and min-run procedures described in “Bioinformatic Analysis” section were applied to the randomized data. The FDR was computed as FDR(threshold) = N1(threshold)/N2(threshold), where N1 is the number of discovered blocks for the randomized data and N2 is the number of blocks for the nonrandomized data. FDR increases as the threshold for calling a positive signal decreases.
Figure 4.
Figure 4.
Fraction of 3′ ends shared between HeLa and NB4 cells as a function of the threshold used for identifying 3′ end signals. Open circles represent the fraction of NB4 3′ end signals that are also present in HeLa, and filled circles represent the fraction of HeLa 3′ ends that are also present in NB4 cells.
Figure 5.
Figure 5.
Example of the most common pattern for histone and polymerase modifications at the 3′ ends of expressed genes. Chromatin IP results from the chromosome 22q12-q13 region are displayed with the Integrated Genome Browser (IGB) on Human Assembly 7. FBXO7 gene is annotated at this locus. Two antibody groups were used: Group A, human histone modifications; Group B, various phosphorylation states of human PolII. All the chromatin immunoprecipitates were prepared from HeLa cells unless starred to indicate the results were from K562 cells. The information about antibodies used for the data in Figs. 5, 6, 7, 8 is listed in Table 3.The first row shows the RNA polyadenylation signal, which was detected by the 3′ end enrichment method. This 3′ end signal corresponds exactly to the reported 3′ end of the mRNA (RefSeq). Dimethylation of histone 3 lysine 4 extends over a broader region than trimethylation of lysine 4. PolII serine 5 phosphorylation always shows a peak at the 5′ end of the gene. As expected, serine 2 phosphorylation extends through the body of the gene and beyond the poly(A) site. The signal increases just before disappearance of the polymerase from DNA, indicating RNA polymerase pausing occurs before release. Histone 3 K36 trimethylation tracks with PolII serine 2 through the body of the gene; however, just beyond the poly(A) site, trimethylation begins to decrease and apparently becomes uncoupled from serine 2 phosphorylation.
Figure 6.
Figure 6.
Chromatin IP results for a region containing the gene RPS9, an example of another pattern of histone and PolII modification. The analyses and data are as described in the legend for Figure 5. RPS9 is a highly transcribed gene. The results show that almost all the antigens are detectable throughout the entire region except for the absence of histone 3 dimethyl lysine 36.
Figure 7.
Figure 7.
Example of another type of deviation from the standard pattern. In this figure, the dimethylation of both histone 3 lysine 36 (K36) and lysine 4 (K4) extends across the entire gene. Interestingly, histone dimethyl lysine 36 is also enriched for some distance upstream of the 5′ end of the CTGF gene and then decreased to lower levels over most of the body of the gene. Histone dimethyl lysine 4 shows almost the inverse pattern of dimethyl lysine 36, increasing later than lysine 36, mainly retained over the body of the gene, and dropping just before the 3′ end signal appears. It seems that PolII (4H8) and acetylated histone 4 were similarly distributed to histone dimethyl lysine 36 throughout this whole region. Unlike typical genes, trimethylations at lysine 4 and lysine 36 sites were essentially absent. Note that transcription of this gene proceeds right to left.
Figure 8.
Figure 8.
An example of another type of deviation from the standard pattern. In several large genes, such as SERPINB8, there are stretches of histone lysine 36 (K36) dimethylation extending over tens of kilobases and alternating with stretches of trimethylation. In some other genes, the pattern is revered with the 5′ end portion showing trimethylation. The functional significance of these patterns remains to be determined.
Scheme 1.
Scheme 1.

Similar articles

Cited by

References

    1. Ahn S.H., Kim M., Buratowski S., Kim M., Buratowski S., Buratowski S. Phosphorylation of serine 2 within the RNA polymerase II C-terminal domain couples transcription and 3′ end processing. Mol. Cell. 2004;13:67–76. - PubMed
    1. Barski A., Cuddapah S., Cui K., Roh T.Y., Schones D.E., Wang Z., Wei G., Chepelev I., Zhao K., Cuddapah S., Cui K., Roh T.Y., Schones D.E., Wang Z., Wei G., Chepelev I., Zhao K., Cui K., Roh T.Y., Schones D.E., Wang Z., Wei G., Chepelev I., Zhao K., Roh T.Y., Schones D.E., Wang Z., Wei G., Chepelev I., Zhao K., Schones D.E., Wang Z., Wei G., Chepelev I., Zhao K., Wang Z., Wei G., Chepelev I., Zhao K., Wei G., Chepelev I., Zhao K., Chepelev I., Zhao K., Zhao K. High-resolution profiling of histone methylations in the human genome. Cell. 2007;129:823–837. - PubMed
    1. Beaudoing E., Freier S., Wyatt J.R., Claverie J.M., Gautheret D., Freier S., Wyatt J.R., Claverie J.M., Gautheret D., Wyatt J.R., Claverie J.M., Gautheret D., Claverie J.M., Gautheret D., Gautheret D. Patterns of variant polyadenylation signal usage in human genes. Genome Res. 2000;10:1001–1010. - PMC - PubMed
    1. Bernstein B.E., Kamal M., Lindblad-Toh K., Bekiranov S., Bailey D.K., Huebert D.J., McMahon S., Karlsson E.K., Kulbokas E.J., Gingeras T.R., Kamal M., Lindblad-Toh K., Bekiranov S., Bailey D.K., Huebert D.J., McMahon S., Karlsson E.K., Kulbokas E.J., Gingeras T.R., Lindblad-Toh K., Bekiranov S., Bailey D.K., Huebert D.J., McMahon S., Karlsson E.K., Kulbokas E.J., Gingeras T.R., Bekiranov S., Bailey D.K., Huebert D.J., McMahon S., Karlsson E.K., Kulbokas E.J., Gingeras T.R., Bailey D.K., Huebert D.J., McMahon S., Karlsson E.K., Kulbokas E.J., Gingeras T.R., Huebert D.J., McMahon S., Karlsson E.K., Kulbokas E.J., Gingeras T.R., McMahon S., Karlsson E.K., Kulbokas E.J., Gingeras T.R., Karlsson E.K., Kulbokas E.J., Gingeras T.R., Kulbokas E.J., Gingeras T.R., Gingeras T.R., et al. Genomic maps and comparative analysis of histone modifications in human and mouse. Cell. 2005;120:169–181. - PubMed
    1. Bertone P., Stolc V., Royce T.E., Rozowsky J.S., Urban A.E., Zhu X., Rinn J.L., Tongprasit W., Samanta M., Weissman S., Stolc V., Royce T.E., Rozowsky J.S., Urban A.E., Zhu X., Rinn J.L., Tongprasit W., Samanta M., Weissman S., Royce T.E., Rozowsky J.S., Urban A.E., Zhu X., Rinn J.L., Tongprasit W., Samanta M., Weissman S., Rozowsky J.S., Urban A.E., Zhu X., Rinn J.L., Tongprasit W., Samanta M., Weissman S., Urban A.E., Zhu X., Rinn J.L., Tongprasit W., Samanta M., Weissman S., Zhu X., Rinn J.L., Tongprasit W., Samanta M., Weissman S., Rinn J.L., Tongprasit W., Samanta M., Weissman S., Tongprasit W., Samanta M., Weissman S., Samanta M., Weissman S., Weissman S., et al. Global identification of human transcribed sequences with genome tiling arrays. Science. 2004;306:2242–2246. - PubMed

Publication types

LinkOut - more resources