. 2008 Jun;10(6):643-53.
doi: 10.1038/ncb1727. Epub 2008 May 18.

The HECT-domain ubiquitin ligase Huwe1 controls neural differentiation and proliferation by destabilizing the N-Myc oncoprotein

Affiliations

The HECT-domain ubiquitin ligase Huwe1 controls neural differentiation and proliferation by destabilizing the N-Myc oncoprotein

Xudong Zhao et al. Nat Cell Biol. 2008 Jun.

Abstract

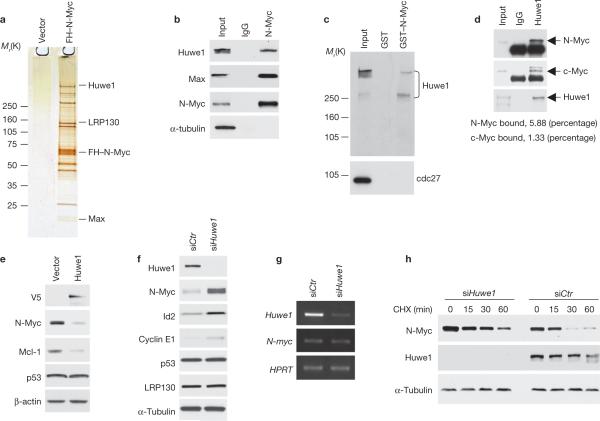
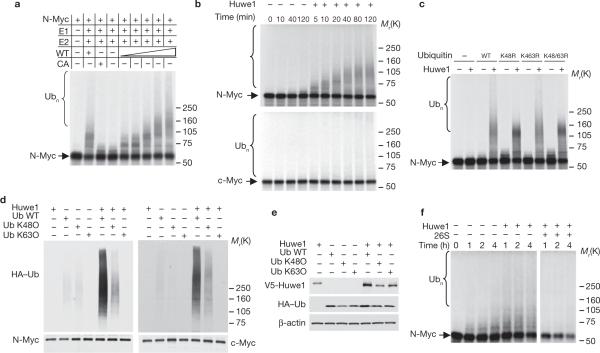
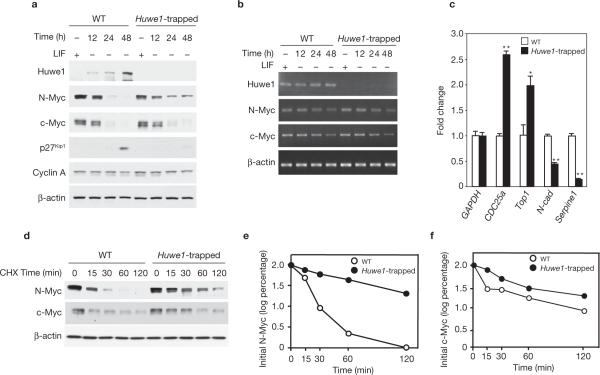
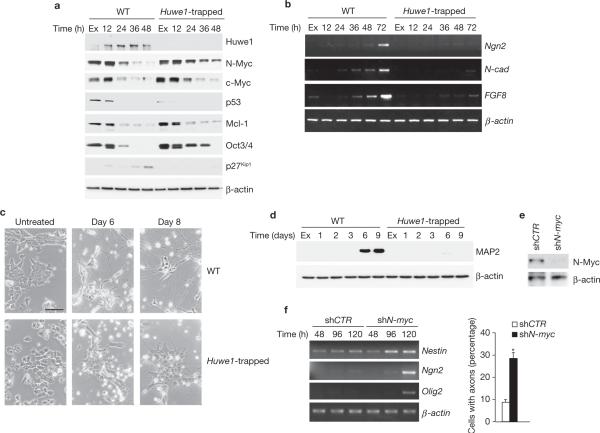
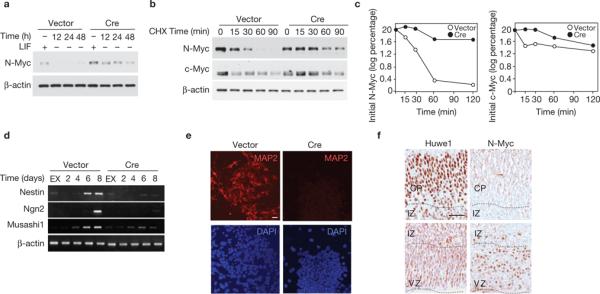
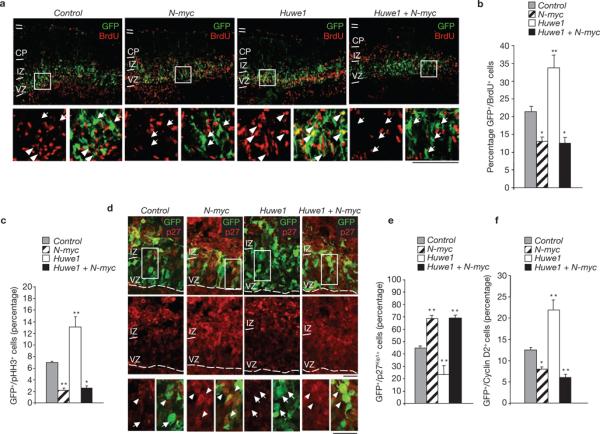
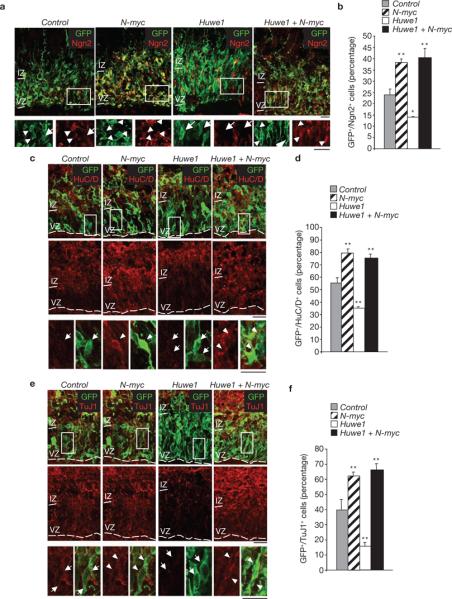
Development of the nervous system requires that timely withdrawal from the cell cycle be coupled with initiation of differentiation. Ubiquitin-mediated degradation of the N-Myc oncoprotein in neural stem/progenitor cells is thought to trigger the arrest of proliferation and begin differentiation. Here we report that the HECT-domain ubiquitin ligase Huwe1 ubiquitinates the N-Myc oncoprotein through Lys 48-mediated linkages and targets it for destruction by the proteasome. This process is physiologically implemented by embryonic stem (ES) cells differentiating along the neuronal lineage and in the mouse brain during development. Genetic and RNA interference-mediated inactivation of the Huwe1 gene impedes N-Myc degradation, prevents exit from the cell cycle by opposing the expression of Cdk inhibitors and blocks differentiation through persistent inhibition of early and late markers of neuronal differentiation. Silencing of N-myc in cells lacking Huwe1 restores neural differentiation of ES cells and rescues cell-cycle exit and differentiation of the mouse cortex, demonstrating that Huwe1 restrains proliferation and enables neuronal differentiation by mediating the degradation of N-Myc. These findings indicate that Huwe1 links destruction of N-Myc to the quiescent state that complements differentiation in the neural tissue.


Figures

Figure 1
Figure 1
Huwe1 binds N-Myc in vivo and controls N-Myc stability. (a) Identification of Huwe1 in N-Myc complexes from human neuroblastoma cells. Silver staining of affinity purified FH–N-Myc complexes from IMR32 cells. Specific N-Myc-interacting proteins were identified by mass spectrometry and are indicated. (b) Lysates from IMR32 cells were immunoprecipitated with an anti-N-Myc antibody or normal mouse IgG (IgG). Western blotting was performed using anti-Huwe1, anti-Max and anti-N-Myc antibodies. α-tubulin is shown as a negative control for binding. Input is 1/100th of total extracts. (c) Lysates from IMR32 cells were mixed with GST or GST–N-Myc fusion proteins. Bound proteins were analysed by western blotting for Huwe1 or cdc27. Input is 1/50. Molecular markers are indicated on the left. (d) Lysates of U2OS cells stably expressing N-Myc were immunoprecipitated with antibodies directed against Huwe1 or rabbit IgG (IgG). Immunoprecipitates were resolved on SDS–PAGE and analysed by western blotting using the indicated antibodies. Input is 1/250. The percentage of cellular N-Myc and c-Myc associated with Huwe1 is indicated. (e) IMR32 cells were transfected with plasmids expressing the V5-tagged full-length Huwe1 or the empty vector. The levels of endogenous N-Myc, p53 and Mcl-1 were examined by immunoblotting. The V5 antibody was used to detect exogenously expressed Huwe1. (f) IMR32 cells were transfected with control (siCTR) or Huwe1 (siHuwe1) siRNA. Lysates were analysed by immunoblotting for the indicated proteins. (g) Parallel samples were analysed for gene expression by semi-quantitative RT–PCR. (h) IMR32 cells were transfected with control (siCTR) or Huwe1 (siHuwe1) siRNA and treated with cycloheximide (CHX) for the indicated times. α-tubulin is shown as a control for loading. Full scans of immunoblots are shown in Supplementary Information, Fig. S9.
Figure 2
Figure 2
Huwe1 ubiquitinates and directs N-Myc degradation by the proteasome. (a) In vitro-translated, 35S-labelled N-Myc was incubated with increasing concentrations of wild-type Huwe1 (WT) or Huwe1–CA (CA) in the absence or presence of ubiquitin and the E2 protein UbcH5, as indicated, for 60 min at 37 °C. (b) In vitro-translated, 35S-labelled-N-Myc (upper panel) or c-Myc (lower panel) were incubated in the presence or in the absence of Huwe1 for the indicated times and the abundance of 35S-labelled Myc proteins was detected by fluorography. (c) Huwe1 catalyses the assembly of Lys 48-linked polyubiquitin chains on N-Myc in vitro. Ubiquitination of N-Myc by Huwe1 was carried out in the presence of either wild-type ubiquitin or the indicated ubiquitin mutants for 60 min at 37 °C. 35S-labelled N-Myc was detected by fluorography. (d) In vivo ubiquitination of Myc proteins by Huwe1. U2OS cells stably transfected with the retroviral expression plasmid pLZRS–N-Myc were cotransfected with empty vector or V5–Huwe1 and wild-type HA–ubiquitin (WT) or the mutants Lys 48 only (K48O) or Lys 63 only (K63O). After treatment with MG132 (5 μM) for 3 h, lysates were prepared in denaturing buffer and identical aliquots were immunoprecipitated with antibodies directed against N-Myc (left panel) or c-Myc (right panel). An anti-HA antibody was used to detect ubiquitin conjugates. Note that the efficiency of K48O-mediated ubiquitination is underestimated, compared with ubiquitination by WT ubiquitin, as a consequence of reduced expression of V5-Huwe1. (e) Total extracts from the experiment in d were analysed by immunoblotting with an anti-HA antibody to detect ubiquitin monomers and an anti-V5 antibody to detect V5-tagged Huwe1 full-length. β-actin is a control for loading. (f) Ubiquitination of N-Myc by Huwe1 was carried out in the absence or presence of 26S proteasome particles, for the indicated times at 37 °C. 35S-labelled N-Myc was detected by fluorography of SDS–PAGE electrophoresed reactions. The bracket marks bands corresponding to polyubiquitinated N-Myc. Full scans of immunoblots are shown in Supplementary Information, Fig. S9.
Figure 3
Figure 3
Genetic inactivation of Huwe1 impairs N-Myc degradation. (a) Wild-type and Huwe1-trapped ES cells were plated in the presence of LIF and 18 h later deprived of LIF for the indicated times. Lysates were analysed by immunoblotting using the indicated antibodies. (b) Parallel cultures were analysed for expression of Huwe1, N-myc, c-myc and β-actin by semi-quantitative RT–PCR. (c) Quantitative real-time PCR (qRT–PCR) analysis of the mRNA of selected Myc target genes in wild-type and Huwe1-trapped ES cells. Data represent mean ± s.e.m. (n = 3; *P < 0.01 **P < 0.001 Student's t-test). (d) Wild-type and Huwe1-trapped ES cells were treated with CHX for the indicated times 24 h after LIF deprivation. Lysates were analysed by western blotting using anti-N-Myc and anti-c-Myc antibodies. β-actin is shown as a control for loading. (e) Quantification of N-Myc from the experiment in d. (f) Quantification of c-Myc from the experiment in d. Full scans of immunoblots are shown in Supplementary Information, Fig. S9.
Figure 4
Figure 4
Blockade of neuronal differentiation by genetic inactivation of Huwe1 is rescued by silencing of N-myc. (a) Wild-type and Huwe1-trapped ES cells were plated in differentiation medium and collected at the indicated times. Lysates were analysed by immunoblotting using the indicated antibodies. (b) Cells treated as in a were examined for gene expression by semi-quantitative RT–PCR. (c) Cells cultured for 4 days in differentiation medium were trypsinized and re-plated in the same medium on poly-d-lysine- and laminin-coated dishes. Bright-field images were taken 2 (day 6) and 4 (day 8) days after re-plating. Scale bar is 40 μm. (d) Cultures treated as in c were collected at the indicated times and analysed by immunoblotting using the neuronal marker MAP2. (e) Cells transduced with lentivirus expressing shRNA against N-myc or control lentivirus were analysed by western blotting using antibodies directed against N-Myc. β-actin is shown as a control for loading. (f) Cells treated as in e were plated in differentiation medium, collected at the indicated times and examined for gene expression by semi-quantitative RT–PCR (left panel). The number of cells showing axonal projections was scored. At least 1,500 cells were counted from 36 randomly chosen fields (right panel). Results are mean ± s.e.m. (*P = 4.7 × 10⁻⁸, Student's t-test, n = 3). Full scans of immunoblots are shown in Supplementary Information, Fig. S9.
Figure 5
Figure 5
Conditional knockout of Huwe1 impairs neuronal differentiation in ES cells. (a) ES cells carrying a targeted Huwe1 allele (Huwe1Flox) were infected with retroviral vectors encoding GFP (Vector) or Cre–IRES–GFP (Cre). Cells were deprived of LIF for the indicated times and lysates were analysed by immunoblotting using the indicated antibodies. (b) Vector-and Cre-infected Huwe1Flox ES cells were treated with CHX for the indicated times 24 h after LIF deprivation. Lysates were analysed by immunoblotting. (c) Quantification of N-Myc (left panel) and c-Myc (right panel) from vector- (empty circles) and Cre- (filled circles) infected cells. (d) Analysis of gene expression by semi-quantitative RT–PCR of embryoid bodies derived from vector- and Cre-transduced Huwe1Flox ES cells at different times. (e) Embryoid bodies derived from Vector- and Cretransduced Huwe1Flox ES cells were allowed to adhere after being cultured in suspension for 8 days. After 48 h embryoid bodies were analysed by immunofluorescence microscopy for MAP2. Samples were counterstained with DAPI. Scale bar is 20 μm. (f) Expression of Huwe1 was induced in differentiated neural cells. Adjacent sections of paraffin embedded E15.5 mouse embryos were processed for immunohistochemistry using anti-Huwe1 or anti-N-Myc antibodies. Sections were counterstained with haematoxylin. CP, cortical plate; IZ, intermediate zone; VZ, ventricular zone. Scale bar is 40 μm. Full scans of immunoblots are shown in Supplementary Information, Fig. S9.
Figure 6
Figure 6
The Huwe1–N-Myc pathway in the developing brain. (a) Ex vivo electroporation of control, N-myc, Huwe1 and N-myc + Huwe1 siRNA into E13.5 mouse cortices followed by organotypic slice culture for 1.5 days. Cortical slices were double-labelled with BrdU (red) and GFP (green) to identify transfected cells. Scale bars are 100 μm. (b) Quantification of GFP-positive/BrdU-positive cells. (c) Quantification of GFP-positive/pHH3-positive cells. (d) Cortical slices were double-labelled with p27Kip1 (red) and GFP (green). Scale bars are 50 μm. (e) Quantification of GFP-positive/p27Kip1-positive cells. (f) Quantification of GFP-positive/Cyclin D2-positive cells. Results shown are mean ± s.e.m. of three sections from one experiment (*P < 0.05, **P < 0.01, Student's t-test). Arrowheads indicate GFP-positive/Cy3-positive cells; arrows indicate GFP-positive/Cy3-negative cells. IZ, intermediate zone; VZ, ventricular zone.
Figure 7
Figure 7
Silencing of Huwe1 blocks differentiation of neural progenitors in vivo. (a) Ex vivo electroporation of control, N-myc, Huwe1 and Huwe1 + N-myc siRNA into E13.5 mouse cortices followed by organotypic slice culture for 1.5 days. Cortical slices were double-labelled with Neurogenin2 (Ngn2, red) and GFP (green) to identify transfected cells. (b) Quantification of GFP-positive/Ngn2-positive cells. (c) Cortical slices were double-labelled with the early neuronal marker HuC/D (red) and GFP (green). (d) Quantification of GFP-positive/HuC/D-positive cells. (e) Cortical slices were double-labelled with the mature neuronal marker Tuj1 (red) and GFP (green). (f) Quantification of GFP-positive/Tuj1-positive cells. Results shown in b, d and f are mean ± s.e.m. of four sections for Ngn2, three sections for HuC/D and three sections for TuJ1 from one experiment; *P < 0.05, **P < 0.01, Student's t-test). Arrowheads indicate GFP-positive/Cy3-positive cells; arrows indicate GFP-positive/Cy3-negative cells. Scale bars are 50 μm. IZ, intermediate zone; VZ, ventricular zone.

Similar articles

Cited by

References

    1. Stanton BR, Perkins AS, Tessarollo L, Sassoon DA, Parada LF. Loss of N-Myc function results in embryonic lethality and failure of the epithelial component of the embryo to develop. Genes Dev. 1992;6:2235–2247. - PubMed
    1. Stanton BR, Parada LF. The N-Myc proto-oncogene: developmental expression and in vivo site-directed mutagenesis. Brain Pathol. 1992;2:71–83. - PubMed
    1. Knoepfler PS, Cheng PF, Eisenman RN. N-Myc is essential during neurogenesis for the rapid expansion of progenitor cell populations and the inhibition of neuronal differentiation. Genes Dev. 2002;16:2699–2712. - PMC - PubMed
    1. Kenney AM, Cole MD, Rowitch DH. N-Myc upregulation by sonic hedgehog signaling promotes proliferation in developing cerebellar granule neuron precursors. Development. 2003;130:15–28. - PubMed
    1. Kenney AM, Widlund HR, Rowitch DH. Hedgehog and PI-3 kinase signaling converge on N-Myc1 to promote cell cycle progression in cerebellar neuronal precursors. Development. 2004;131:217–228. - PubMed

Publication types