

Thinning of sensorimotor cortices in children with Tourette syndrome
- PMID: 18488025
- PMCID: PMC2605107
- DOI: 10.1038/nn.2121
Thinning of sensorimotor cortices in children with Tourette syndrome
Abstract
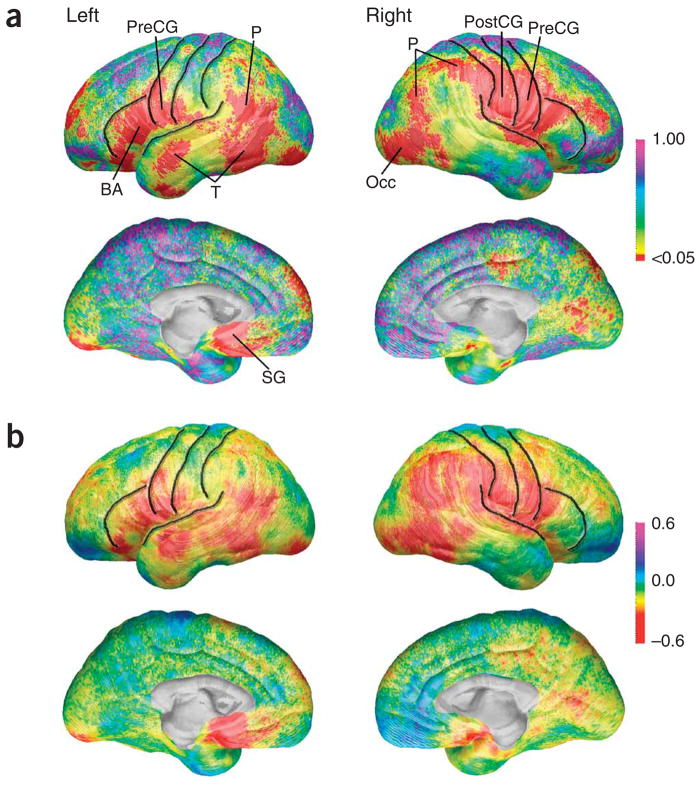
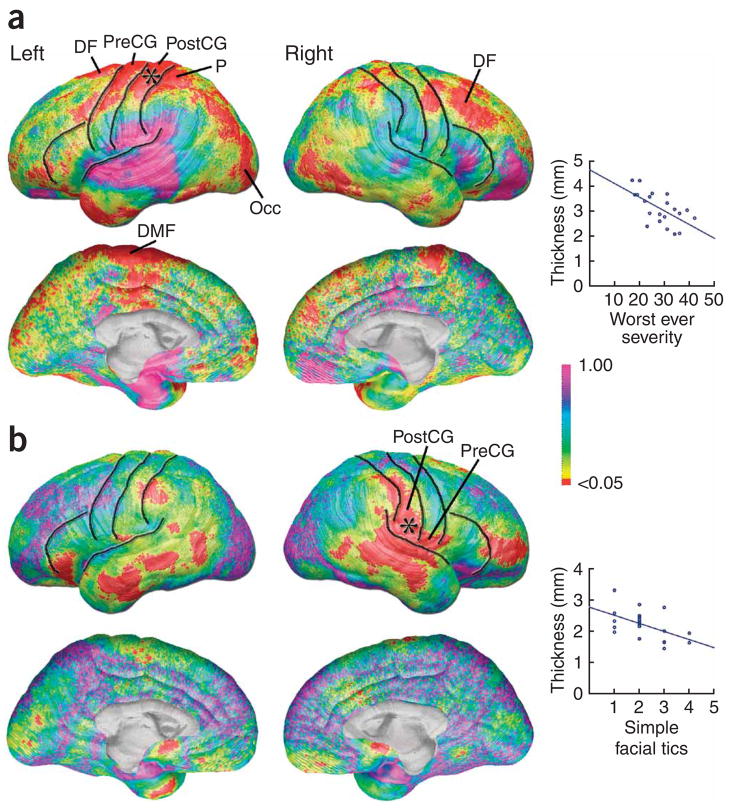
The basal ganglia portions of cortico-striato-thalamo-cortical (CSTC) circuits have consistently been implicated in the pathogenesis of Tourette syndrome, whereas motor and sensorimotor cortices in these circuits have been relatively overlooked. Using magnetic resonance imaging, we detected cortical thinning in frontal and parietal lobes in groups of Tourette syndrome children relative to controls. This thinning was most prominent in ventral portions of the sensory and motor homunculi that control the facial, orolingual and laryngeal musculature that is commonly involved in tic symptoms. Correlations of cortical thickness in sensorimotor regions with tic symptoms suggest that these brain regions are important in the pathogenesis of Tourette syndrome.
Figures
References
-
- Albin RL, Mink JW. Trends Neurosci. 2006;29:175–182. - PubMed
-
- Hyde TM, et al. Neurology. 1995;45:1176–1182. - PubMed
-
- Peterson BS, et al. Arch Gen Psychiatry. 2003;60:415–424. - PubMed
-
- Fredericksen KA, et al. Neurology. 2002;58:85–89. - PubMed
-
- Peterson BS, et al. Arch Gen Psychiatry. 2001;58:427–440. - PubMed
Publication types
MeSH terms
Grants and funding
- R21 EB001561/EB/NIBIB NIH HHS/United States
- EB01651/EB/NIBIB NIH HHS/United States
- MH068318/MH/NIMH NIH HHS/United States
- P41 RR013642/RR/NCRR NIH HHS/United States
- LM05639/LM/NLM NIH HHS/United States
- MH59139/MH/NIMH NIH HHS/United States
- R01 MH068318/MH/NIMH NIH HHS/United States
- MHK02-74677/PHS HHS/United States
- NS3753/NS/NINDS NIH HHS/United States
- K01 MH001733/MH/NIMH NIH HHS/United States
- AG016570/AG/NIA NIH HHS/United States
- R21 RR019771/RR/NCRR NIH HHS/United States
- R01 LM005639/LM/NLM NIH HHS/United States
- RR019771/RR/NCRR NIH HHS/United States
- P50 AG016570/AG/NIA NIH HHS/United States
- K01 MH01733/MH/NIMH NIH HHS/United States
- R01 MH059139/MH/NIMH NIH HHS/United States
- K02 MH074677/MH/NIMH NIH HHS/United States
- U54 RR021813/RR/NCRR NIH HHS/United States
LinkOut - more resources
Full Text Sources
Other Literature Sources
Medical
