. 2008;3(1):83-94.

Cytotoxicity and reactive oxygen species generation from aggregated carbon and carbonaceous nanoparticulate materials

Affiliations

Cytotoxicity and reactive oxygen species generation from aggregated carbon and carbonaceous nanoparticulate materials

Kristine M Garza et al. Int J Nanomedicine. 2008.

Abstract

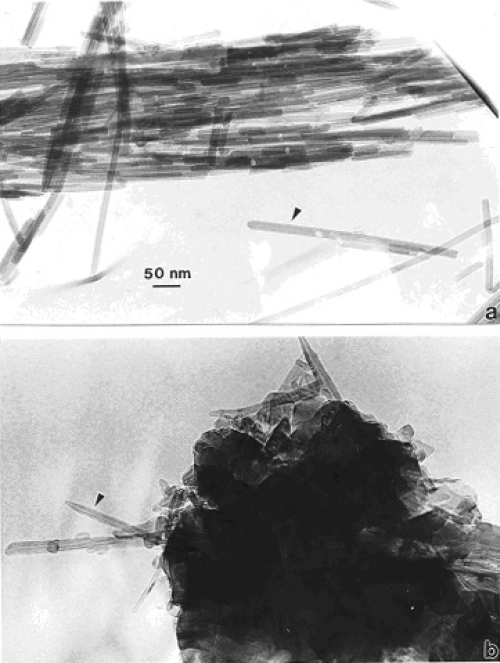
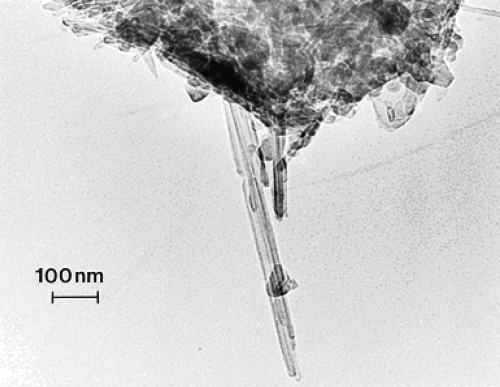
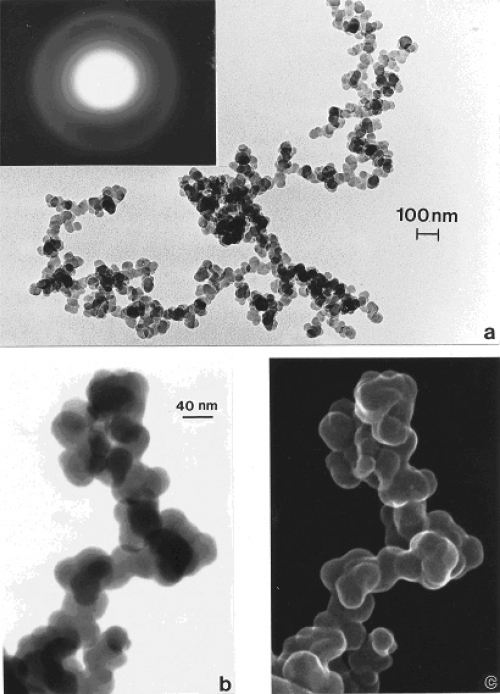
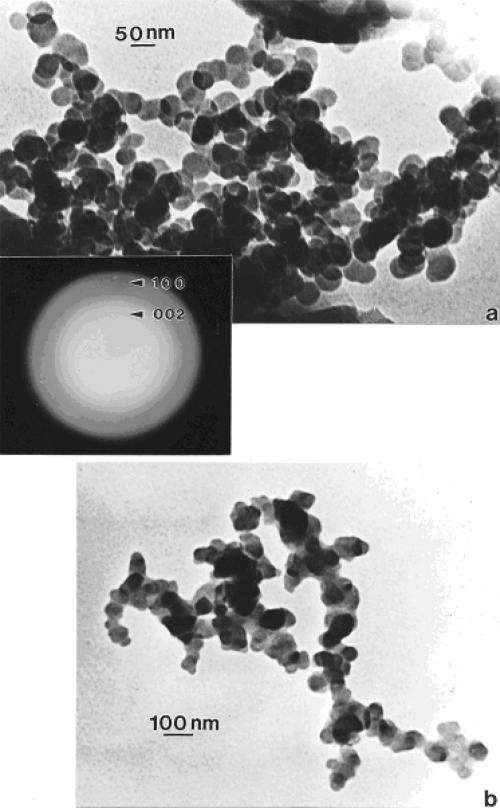
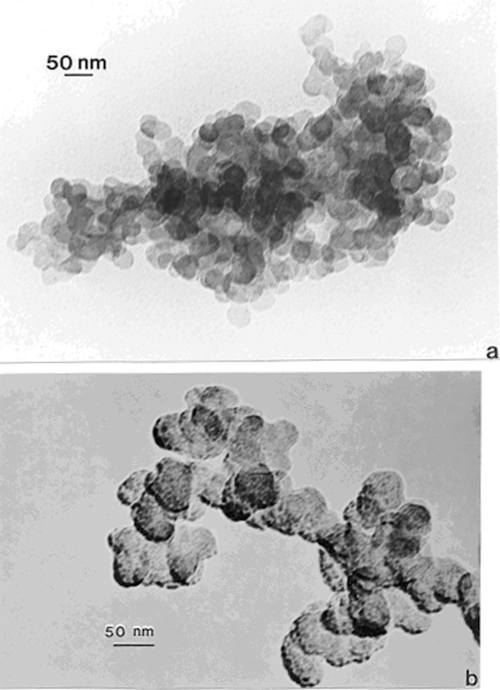
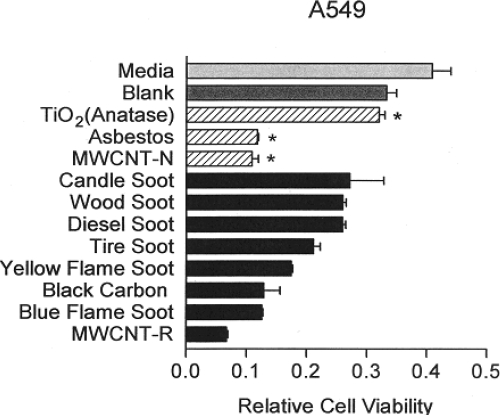
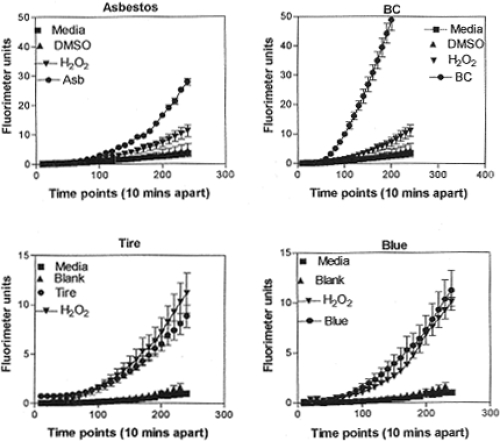
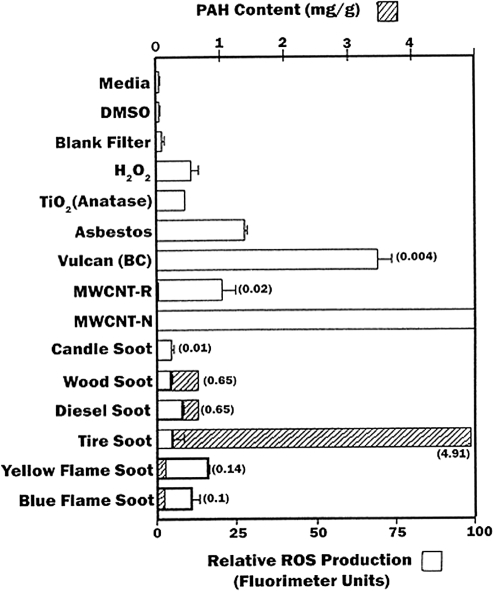
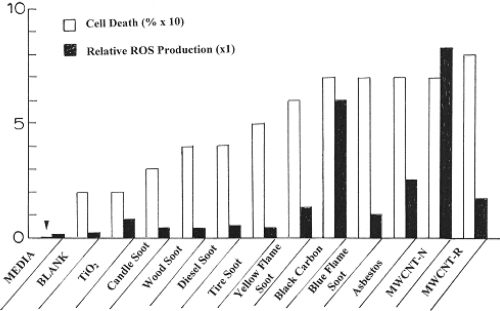
We have investigated the cytotoxicity and reactive oxygen species (ROS) generation for indoor and outdoor soots: candle, wood, diesel, tire, and natural gas burner soots--along with surrogate black carbon, various multiwall carbon nanotube aggregate materials, TiO2 (anatase) and chrysotile asbestos as reference materials. All soots were observed utilizing TEM and FESEM to be composed of aggregated, primary spherules (20-80 nm diameter) forming complex, branched fractal structures. These spherules were composed of intercalated, turbostratic arrangements of curved graphene fragments with varying concentrations ofpolycyclic aromatic hydrocarbon (PAH) isomers. In vitro cultures with an immortalized human lung epithelial carcinoma cell line (A549) treated with these materials showed decreased cell viability and variations in ROS production, with no correlations to PAH content. The data demonstrate that soots are cytotoxic and that cytotoxicity is not related to PAH content but is related to ROS generation, suggesting that soot induces cellular oxidative stress and that cell viability assays can be indicators of ROS production.


Figures

Figure 1
Figure 1
TEM images comparing chrysotile asbestos aggregate (a) with a MWCNT aggregate collected above a natural gas kitchen burner (b). The arrows in (a) and (b) illustrate the essentially identical nanotube structure and dimensions.
Figure 2
Figure 2
TEM image of commercial, arc-evaporation-produced MWCNT-R aggregate material for comparison with Figure 1.
Figure 3
Figure 3
Examples of tire soot nanostructure. (a) TEM image and SAED pattern insert for a portion of a large fractal-like aggregate collected by thermal precipitation (Bang et al 2003) on a SiO/formvar-coated grid. (b) STEM image of an aggregate segment observed in the FESEM at 20 kV accelerating potential. (c) Corresponding SEM image of (b).
Figure 4
Figure 4
Wood soot examples observed in the TEM (burning douglas fir and larch PM collected on filters and scraped off onto TEM grid sandwich). (a) Large, dense aggregate with superimposed SAED pattern illustrating prominent, (but diffuse) graphite reflections. (b) smaller, fractal-like aggregate.
Figure 5
Figure 5
TEM images of soot aggregates collected by thermal precipitation in homes. (a) Candle soot. (b) Unknown soot PM collected in a kitchen.
Figure 6
Figure 6
Direct contact, filter-collected soot PM aggregate and surrogate BC and MWCNT 48 h assays [36] compared with conventional cytotoxicity assay data (*). Data from Soto and colleagues (2006, . The relative cell viability at 48 h for A549 human epithelial (cancer) cell cultures was ascertained for filter-collected soot and for indicated materials at 5 μg/ml. The “blank” is a blank reference filter in culture. Yellow flame and blue flame soot refer to rich (oxygen depleted) natural gas combustion and efficient natural gas combustion. Data are presented as the mean ± SEM of duplicate wells and are one of three representative experiments.
Figure 7
Figure 7
Examples of ROS generation of A549 cells. Media-treated cells and H2O2-treated cells were used as negative and positive controls, respectively and DMSO-treated cells functioned as a vehicle control. Presence of ROS was determined by the relative increase in fluorescence over time as shown. From Soto and colleagues (2008). Data are presented as the mean ± SEM of quadruplicate wells and are one of three representative experiments.
Figure 8
Figure 8
Summary of ROS generation and some corresponding total PAH content (data from Shi and colleagues (2007)) as cross-hatched and concentration noted in parentheses. Open bars show ROS generation by A549 cells 240 minutes after the addition of the DCA-DF dye following a 48 h treatment (incubation of cells with particulate matter). ROS data are presented as the mean ± SEM of quadruplicate representative experiments, after Soto and colleagues (2008).
Figure 9
Figure 9
Comparison of cell death (percent) and relative ROS production for the nanoparticulate materials studied in this research program. The arrow at left is indicative of the media cell death reference at zero.

References

    1. Bell AT. The impact of nanoscience on heterogeneous catalysis. Science. 2003;299:1688–92. - PubMed
    1. Bang JJ, Trillo EA, Murr LE. Utilization of selected area electron diffraction patterns for characterization of air submicron particulate matter collected by a thermal precipitator. J Air and Waste Manag Assoc. 2003;53:227–36. - PubMed
    1. Chalupa DC, Morrow PE, Oberdörster G, et al. Ultrafine particle deposition in subjects with asthma. Environ Health Perspect. 2004;112:879–82. - PMC - PubMed
    1. Dahl A, Ghariba A, Swieflicki E, et al. Traffic-generated emissions of ultrafine particles from pavement – tire interface. Atmos Environ. 2006;71:1314–23.
    1. D’Amato G, Liccordi G. Outdoor environmental injury of the airways and development of allergic respiratory diseases. Pulmon Pharmacol Ther. 1998;11:369–74. - PubMed

Publication types

LinkOut - more resources