

Estimating the size of the solution space of metabolic networks
- PMID: 18489757
- PMCID: PMC2483728
- DOI: 10.1186/1471-2105-9-240
Estimating the size of the solution space of metabolic networks
Abstract
Background: Cellular metabolism is one of the most investigated system of biological interactions. While the topological nature of individual reactions and pathways in the network is quite well understood there is still a lack of comprehension regarding the global functional behavior of the system. In the last few years flux-balance analysis (FBA) has been the most successful and widely used technique for studying metabolism at system level. This method strongly relies on the hypothesis that the organism maximizes an objective function. However only under very specific biological conditions (e.g. maximization of biomass for E. coli in reach nutrient medium) the cell seems to obey such optimization law. A more refined analysis not assuming extremization remains an elusive task for large metabolic systems due to algorithmic limitations.
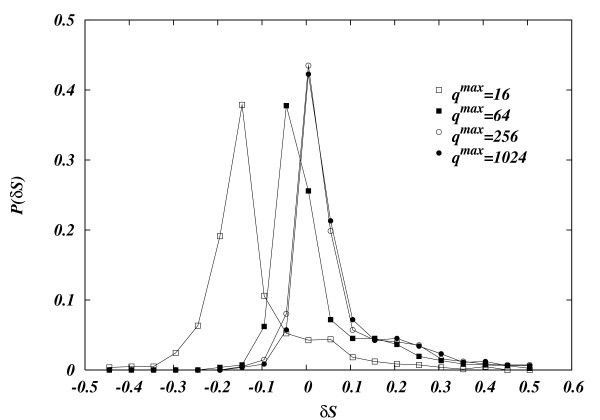
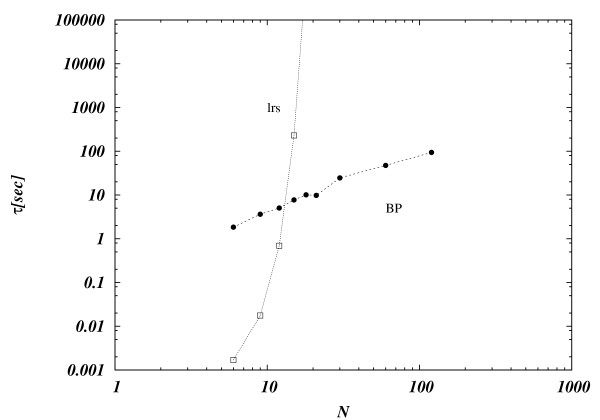
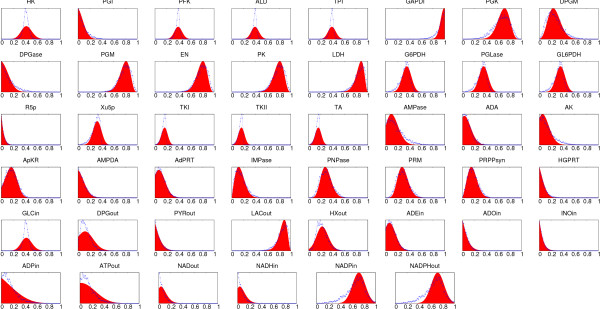
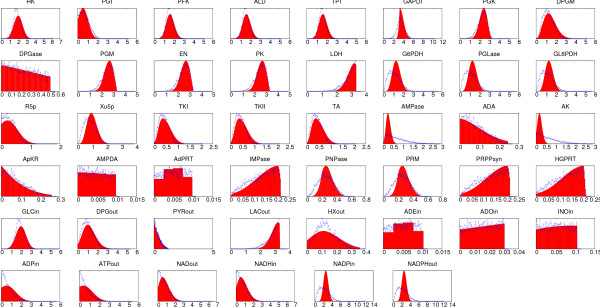
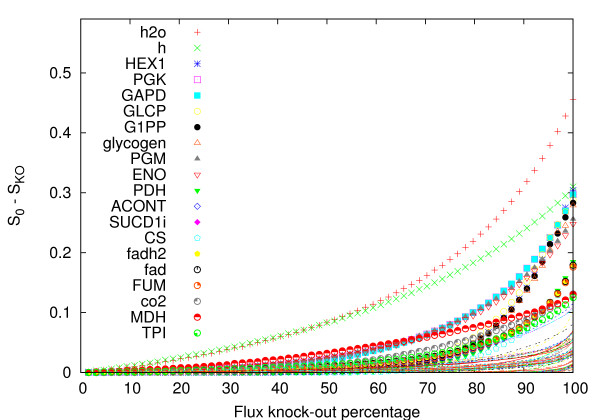
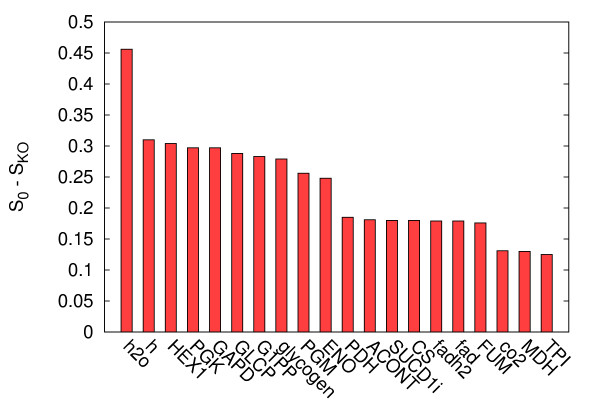
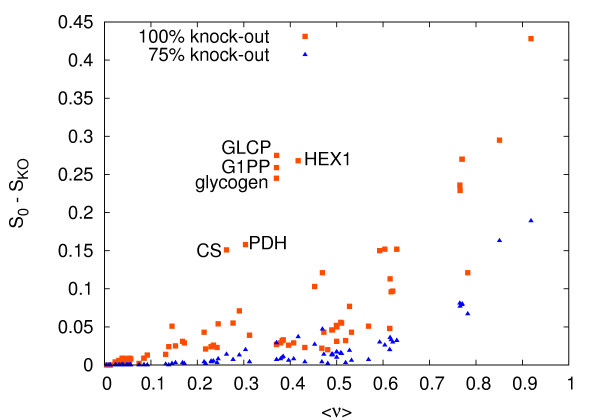
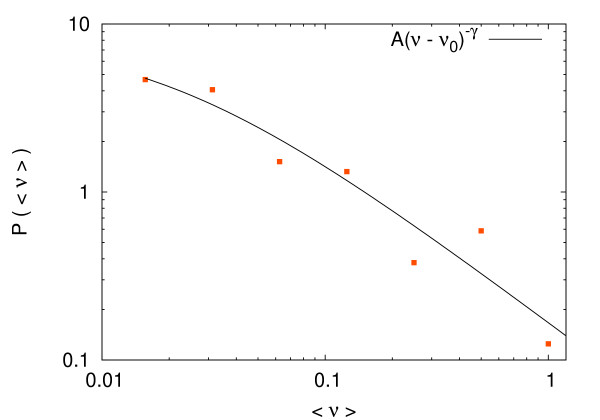
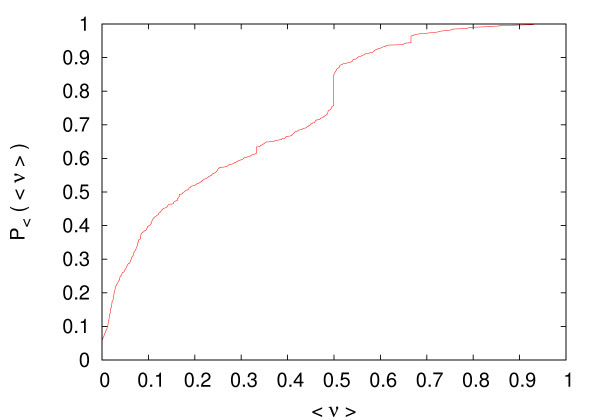
Results: In this work we propose a novel algorithmic strategy that provides an efficient characterization of the whole set of stable fluxes compatible with the metabolic constraints. Using a technique derived from the fields of statistical physics and information theory we designed a message-passing algorithm to estimate the size of the affine space containing all possible steady-state flux distributions of metabolic networks. The algorithm, based on the well known Bethe approximation, can be used to approximately compute the volume of a non full-dimensional convex polytope in high dimensions. We first compare the accuracy of the predictions with an exact algorithm on small random metabolic networks. We also verify that the predictions of the algorithm match closely those of Monte Carlo based methods in the case of the Red Blood Cell metabolic network. Then we test the effect of gene knock-outs on the size of the solution space in the case of E. coli central metabolism. Finally we analyze the statistical properties of the average fluxes of the reactions in the E. coli metabolic network.
Conclusion: We propose a novel efficient distributed algorithmic strategy to estimate the size and shape of the affine space of a non full-dimensional convex polytope in high dimensions. The method is shown to obtain, quantitatively and qualitatively compatible results with the ones of standard algorithms (where this comparison is possible) being still efficient on the analysis of large biological systems, where exact deterministic methods experience an explosion in algorithmic time. The algorithm we propose can be considered as an alternative to Monte Carlo sampling methods.
Figures
Similar articles
-
Monte Carlo sampling can be used to determine the size and shape of the steady-state flux space.J Theor Biol. 2004 Jun 21;228(4):437-47. doi: 10.1016/j.jtbi.2004.02.006. J Theor Biol. 2004. PMID: 15178193
-
Including metabolite concentrations into flux balance analysis: thermodynamic realizability as a constraint on flux distributions in metabolic networks.BMC Syst Biol. 2007 Jun 1;1:23. doi: 10.1186/1752-0509-1-23. BMC Syst Biol. 2007. PMID: 17543097 Free PMC article.
-
Utilizing elementary mode analysis, pathway thermodynamics, and a genetic algorithm for metabolic flux determination and optimal metabolic network design.BMC Syst Biol. 2010 Apr 23;4:49. doi: 10.1186/1752-0509-4-49. BMC Syst Biol. 2010. PMID: 20416071 Free PMC article.
-
Hierarchical decomposition of metabolic networks using k-modules.Biochem Soc Trans. 2015 Dec;43(6):1146-50. doi: 10.1042/BST20150143. Biochem Soc Trans. 2015. PMID: 26614652 Review.
-
Comparison and analysis of objective functions in flux balance analysis.Biotechnol Prog. 2014 Sep-Oct;30(5):985-91. doi: 10.1002/btpr.1949. Epub 2014 Jul 18. Biotechnol Prog. 2014. PMID: 25044958 Review.
Cited by
-
A novel methodology to estimate metabolic flux distributions in constraint-based models.Metabolites. 2013 Sep 20;3(3):838-52. doi: 10.3390/metabo3030838. Metabolites. 2013. PMID: 24958152 Free PMC article.
-
Genome-scale models of bacterial metabolism: reconstruction and applications.FEMS Microbiol Rev. 2009 Jan;33(1):164-90. doi: 10.1111/j.1574-6976.2008.00146.x. Epub 2008 Dec 3. FEMS Microbiol Rev. 2009. PMID: 19067749 Free PMC article. Review.
-
Obstructions to Sampling Qualitative Properties.PLoS One. 2015 Aug 19;10(8):e0135636. doi: 10.1371/journal.pone.0135636. eCollection 2015. PLoS One. 2015. PMID: 26287384 Free PMC article.
-
A scalable algorithm to explore the Gibbs energy landscape of genome-scale metabolic networks.PLoS Comput Biol. 2012;8(6):e1002562. doi: 10.1371/journal.pcbi.1002562. Epub 2012 Jun 21. PLoS Comput Biol. 2012. PMID: 22737065 Free PMC article.
-
Identifying essential genes in Escherichia coli from a metabolic optimization principle.Proc Natl Acad Sci U S A. 2009 Feb 24;106(8):2607-11. doi: 10.1073/pnas.0813229106. Epub 2009 Feb 5. Proc Natl Acad Sci U S A. 2009. PMID: 19196991 Free PMC article.
References
Publication types
MeSH terms
LinkOut - more resources
Full Text Sources
Molecular Biology Databases
