. 2008 May 19:4:9.
doi: 10.1186/1746-4811-4-9.

Multidimensional fluorescence microscopy of multiple organelles in Arabidopsis seedlings

Affiliations

Multidimensional fluorescence microscopy of multiple organelles in Arabidopsis seedlings

Naohiro Kato et al. Plant Methods. .

Abstract

Background: The isolation of green fluorescent protein (GFP) and the development of spectral variants over the past decade have begun to reveal the dynamic nature of protein trafficking and organelle motility. In planta analyses of this dynamic process have typically been limited to only two organelles or proteins at a time in only a few cell types.

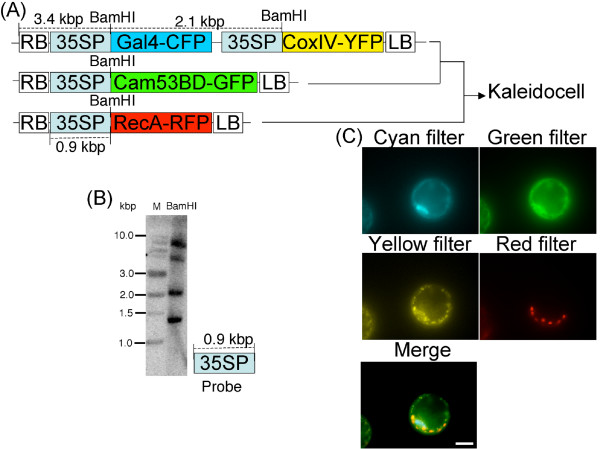
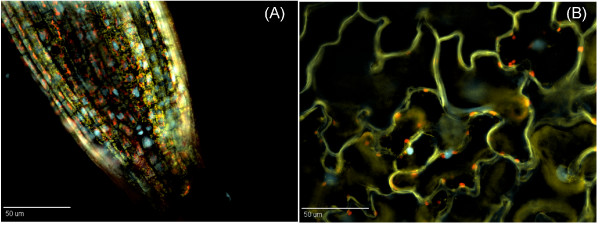
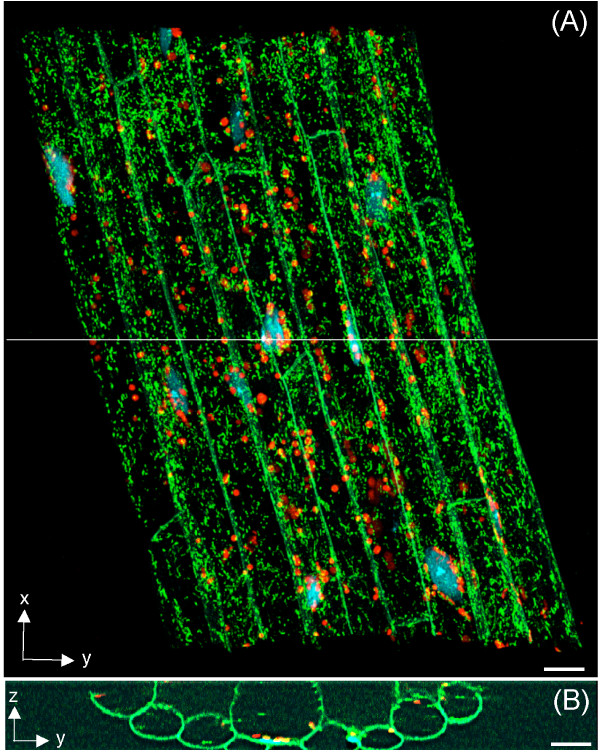
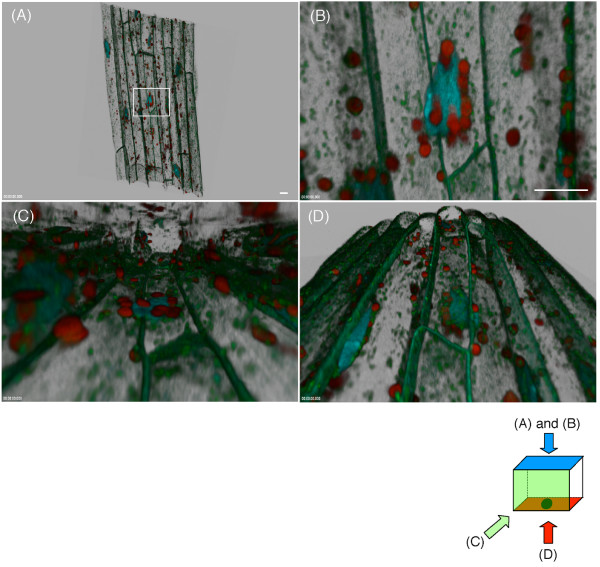
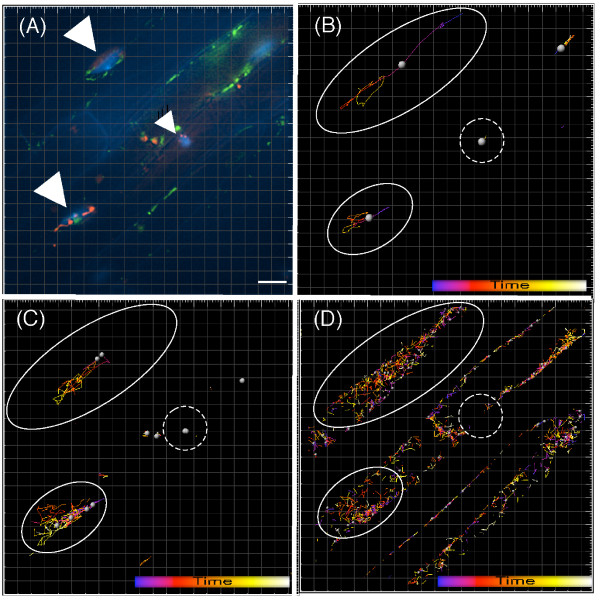
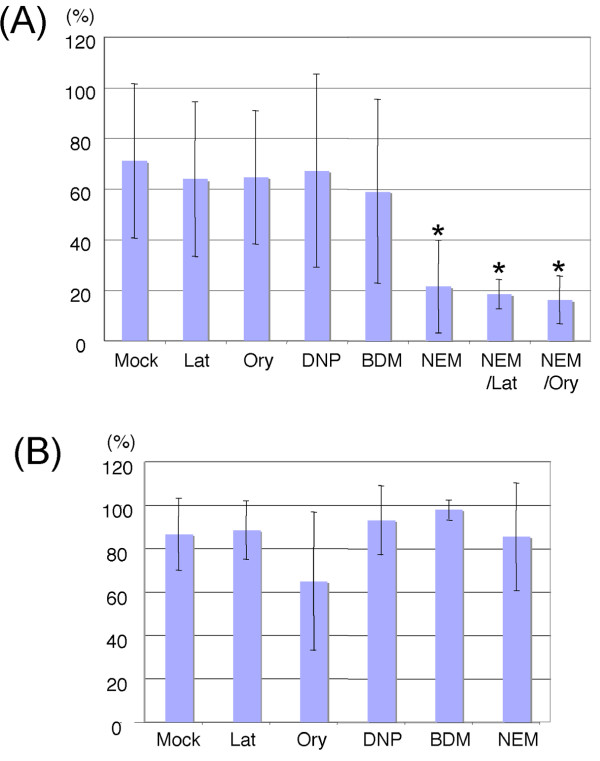
Results: We generated a transgenic Arabidopsis plant that contains four spectrally different fluorescent proteins. Nuclei, plastids, mitochondria and plasma membranes were genetically tagged with cyan, red, yellow and green fluorescent proteins, respectively. In addition, methods to track nuclei, mitochondria and chloroplasts and quantify the interaction between these organelles at a submicron resolution were developed. These analyzes revealed that N-ethylmaleimide disrupts nuclear-mitochondrial but not nuclear-plastids interactions in root epidermal cells of live Arabidopsis seedlings.

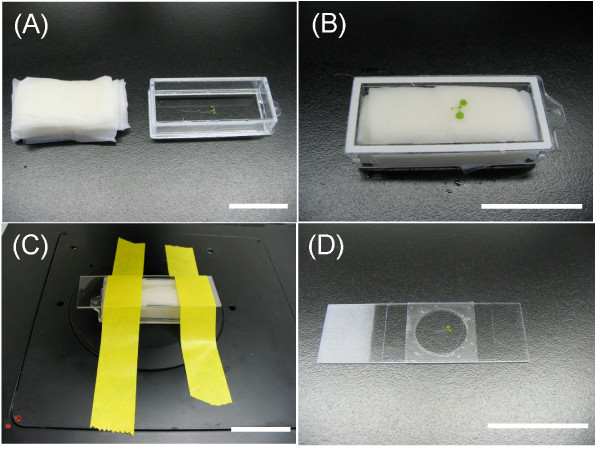
Conclusion: We developed a tool and associated methods for analyzing the complex dynamic of organelle-organelle interactions in real time in planta. Homozygous transgenic Arabidopsis (Kaleidocell) is available through Arabidopsis Biological Resource Center.


Figures

Figure 1
Figure 1
Transgene constructs and their expression in the Kaleidocell line. (A) The fusion genes were inserted downstream of the 35S cauliflower mosaic virus promoter (35SP). Expression cassettes of Gal4-CFP and CoxIV-YFP were inserted in tandem in the transgene region [between the right (RB) and left borders (LB)]. Expression cassettes of Cam53BD-GFP and RecA-RFP were inserted in the transgene region. Unique sites digested by BamHI in the transgenes and the predicted sizes (kbp: kilo base pairs) between the BamHI sites and to the RB were shown on the top of the constructs. The size of the 35SP is also shown on the bottom of the construct. A transgenic plant expressing Gal4-CFP and CoxIV-YFP was crossed with a transgenic plant expressing Cam53BD-GFP. The resulting plant was further crossed with a transgenic plant expressing RecA-RFP. The final transgenic plant expressing all four transgenes was designated as the Kaleidocell line. Gal4: Saccharomyces cerevisiae nuclear protein, CoxIV: Saccharomyces cerevisiae cytochrome oxidase IV, Cam53BD: petunia calmodulin CaM53 binding domain, RecA: Arabidopsis DNA repair protein. (B) Southern blotting analysis of the BamHI digested genomic DNA of homozygous Kaleidocell. Lane M: 1 kb DNA Ladder (NEB), Lane BamHI: BamHI digested genomic DNA. The sizes of the DNA ladder are shown on the left. The DNA probe is shown on the right bottom. (C) Fluorescence microscope images of a protoplast from the Kaleidocell line. The protoplast was observed with four different fluorescence filter sets: cyan, green, yellow, or red. Captured images were merged to generate a single image of the protoplast. Scale bars = 10 μm.
Figure 2
Figure 2
Expression of the transgenes in seedlings in the Kaleidocell line. (A) Fluorescence micrograph of a root meristem from the 7 days-old Kaleidocell line. The root meristem was observed with three different fluorescence filter sets: cyan, yellow, and red. Captured images were merged to generate a single image. (B) Fluorescence micrograph of epidermal cells from the cotyledon of a 7 day-old Kaleidocell plant. The cotyledon was observed with three different fluorescence filter sets: cyan, yellow, and red. Captured images were merged to generate a single image. Scale bars = 50 μm.
Figure 3
Figure 3
Mounting a seedling on an inverted fluorescence microscope. (A) Preparation: each seedling was laid on a chamber-coverglass, and layers of Kimwipes were folded and soaked with distilled water. (B) Mounting: water-soaked Kimwipes were wrung out onto the chamber-coverglass. A bottom view of the chamber-coverglass is shown. (C) Microscope stage setting: a microscope slideglass was used as a lid for the chamber-glass. The chamber-glass was fixed on the stage with labeling tape. (D) Alternative mounting method. Scale bars = 4 cm.
Figure 4
Figure 4
Detection of nuclei, plastids, and mitochondria in a Kaleidocell root. (A) A maximum projection image of a vertical series of scanning confocal micrographs of a root of a Kaleidocell seedling. The root grew along the x-axis. A total of 17 epidermal and 8 cortical cells (green lines) were identified. Cell boarders at the ends of the x-axis (top and bottom of the image) were beyond the scanning area. Within a total of the 25 cells, 11 nuclei (blue spots), 255 plastids (red spots), and 10,158 mitochondria (green spots) were identified. A white thin horizontal line in the middle of the image indicates a point where a cut-through image was generated. (B) Cut-through image of the stacked image. Image contrast was adjusted to enable clear visualization of the cell borders. Scale bars = 10 μm.
Figure 5
Figure 5
Localization of nuclei, plastids, and mitochondria in a 3-D model. The stacked image was converted to a 3-D model (blends projection). In this projection, viewing directions and their transparencies were blended to produce a 3-D perspective of the structure. Viewpoints of each image (A to D) are indicated on the bottom. The box indicates the 3-D coordination of the stacked image. The different colors on each wall indicate the different dimensions. Arrows with a letter indicate the viewpoints of each image. A black ellipse on the bottom of the box indicates the position of a nucleus. (A) The blends projection of the stacked image of Figure 4(A). A white rectangle indicates the area enlarged in (B, C, and D). (B) Top view. A nucleus (blue) interacts with plastids (red) and mitochondria (green). The 3-D coordination was not clear in this viewpoint. (C) Side view of the same nucleus. Note that the plastids lay on the nucleus. Also note that the majority of the organelles localize to the cortex of the cells. (D) Bottom view of the same nucleus. Note that the nucleus lays on the mitochondria. Scale bars = 10 μm.
Figure 6
Figure 6
Movements of nuclei, plastids, and mitochondria. Stacked deconvolution micrographs of root epidermal cells during a 3 h and 40 min long time-lapse observation. (A) Image captured at 2 h and 46 min into the observation period. Nuclei, plastids, and mitochondria appear blue, red, and green, respectively. Triangles indicate the nuclei. Scale bar = 10 μm. (B) Movements of nuclei tracked from 2 h and 27 min to 3 h and 40 min (a total tracking duration of 103 min). Each track is displayed as a line. Line color indicates the time point, corresponding to the time color bar on the right bottom. Solid-line circles indicate areas where the nuclei moved. Dashed-line circles indicate an area where the nucleus stalled. (C) Movements of plastids. Movements are indicated by solid- and dashed-line circles as in (B). (D) Movements of mitochondria. Movements are indicated by solid- and dashed-line circles as in (B). Notice that the tracks of the plastids and mitochondria are similar to that of the nuclei.
Figure 7
Figure 7
Effects of pharmacological compounds on nucleus-mitochondria and nucleus-plastid interactions. Rates of the nuclei interacting with mitochondria (A) or plastids (B) in the root epidermal cells were scored. The columns show averaged interaction-rates in the observed cells with standard deviations. Significantly different (P ≤ 0.01) rates from the mock treated samples are indicated with asterisks. Mock: 0.1% (v/v) dimethyl sulfoxide (N = 128), Lat: 40 μM latrunculin B (N = 88), Ory: 10 μM oryzalin (N = 86), DNP: 40 μM 2, 4-dinitrophenol (N = 34), BDM: 20 μM 2, 3-butanedione monoxime (N = 42), NEM: 50 μM N-ethylmaleimide (N = 84), NEM/Lat: 50 μM N-ethylmaleimide and 40 μM latrunculin (N = 61), NEM/Ory: 50 μM N-ethylmaleimide and 10 μM oryzalin (N = 62).

References

    1. Hiraoka Y, Swedlow JR, Paddy MR, Agard DA, Sedat JW. Three-dimensional multiple-wavelength fluorescence microscopy for the structural analysis of biological phenomena. Seminars in Cell Biology. 1991;2:153–165. - PubMed
    1. Shaner NC, Steinbach PA, Tsien RY. A guide to choosing fluorescent proteins. Nat Methods. 2005;2:905–909. doi: 10.1038/nmeth819. - DOI - PubMed
    1. Fricker M, Runions J, Moore I. Quantitative fluorescence microscopy: from art to science. Annu Rev Plant Biol. 2006;57:79–107. doi: 10.1146/annurev.arplant.57.032905.105239. - DOI - PubMed
    1. Van Gestel K, Verbelen JP. Giant mitochondria are a response to low oxygen pressure in cells of tobacco (Nicotiana tabacum L.) Journal of experimental botany. 2002;53:1215–1218. doi: 10.1093/jexbot/53.371.1215. - DOI - PubMed
    1. Logan DC, Leaver CJ. Mitochondria-targeted GFP highlights the heterogeneity of mitochondrial shape, size and movement within living plant cells. J Exp Bot. 2000;51:865–871. doi: 10.1093/jexbot/51.346.865. - DOI - PubMed

LinkOut - more resources