

Mortality among patients with hypertension from 1995 to 2005: a population-based study
- PMID: 18490639
- PMCID: PMC2374869
- DOI: 10.1503/cmaj.080096
Mortality among patients with hypertension from 1995 to 2005: a population-based study
Abstract
Background: We have reported that the prevalence of diagnosed hypertension increased by 60% from 1995 to 2005 in Ontario. In the present study, we asked whether this increase is explained by a decrease in the mortality rate.
Methods: We performed a population-based cohort study using linked administrative data for Ontario, a Canadian province with over 12 million residents. We identified prevalent cases of hypertension using a validated case-definition algorithm for hypertension, and we examined trends in mortality from 1995 to 2005 among adults aged 20 years and older with hypertension.
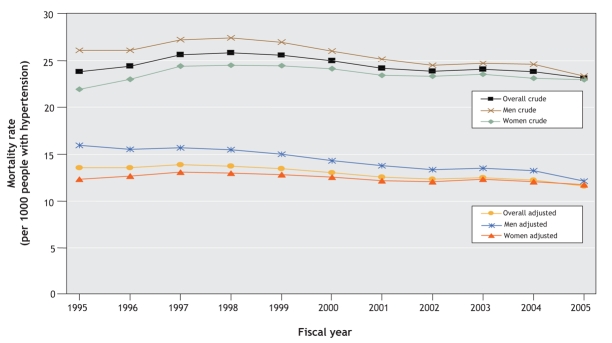
Results: The age- and sex-adjusted mortality among patients with hypertension decreased from 11.3 per 1000 people in 1995 to 9.6 per 1000 in 2005 (p < 0.001), which is a relative reduction of 15.5%. We found that the relative decrease in age-adjusted mortality was higher among men than among women (-22.2% v. -7.3%, p < 0.001).
Interpretation: Mortality rates among patients with hypertension have decreased. Along with an increasing incidence, decreased mortality rates may contribute to the increased prevalence of diagnosed hypertension. Sex-related discrepancies in the reduction of mortality warrant further investigation.
Figures
Comment in
-
Hypertension management in Canada: good news, but important challenges remain.CMAJ. 2008 May 20;178(11):1458-60. doi: 10.1503/cmaj.080296. CMAJ. 2008. PMID: 18490641 Free PMC article. No abstract available.
Similar articles
-
Diagnosed hypertension in Canada: incidence, prevalence and associated mortality.CMAJ. 2012 Jan 10;184(1):E49-56. doi: 10.1503/cmaj.101863. Epub 2011 Nov 21. CMAJ. 2012. PMID: 22105752 Free PMC article.
-
Prevalence and incidence of hypertension from 1995 to 2005: a population-based study.CMAJ. 2008 May 20;178(11):1429-35. doi: 10.1503/cmaj.071283. CMAJ. 2008. PMID: 18490638 Free PMC article.
-
Trends in asthma prevalence and incidence in Ontario, Canada, 1996-2005: a population study.Am J Epidemiol. 2010 Sep 15;172(6):728-36. doi: 10.1093/aje/kwq189. Epub 2010 Aug 17. Am J Epidemiol. 2010. PMID: 20716702
-
Trends in diabetes prevalence, incidence, and mortality in Ontario, Canada 1995-2005: a population-based study.Lancet. 2007 Mar 3;369(9563):750-756. doi: 10.1016/S0140-6736(07)60361-4. Lancet. 2007. PMID: 17336651
-
Epidemiology of myasthenia gravis in Ontario, Canada.Neuromuscul Disord. 2016 Jan;26(1):41-6. doi: 10.1016/j.nmd.2015.10.009. Epub 2015 Oct 27. Neuromuscul Disord. 2016. PMID: 26573434
Cited by
-
Diagnosed hypertension in Canada: incidence, prevalence and associated mortality.CMAJ. 2012 Jan 10;184(1):E49-56. doi: 10.1503/cmaj.101863. Epub 2011 Nov 21. CMAJ. 2012. PMID: 22105752 Free PMC article.
-
A quality improvement plan for hypertension control: the INCOTECA Project (INterventions for COntrol of hyperTEnsion in CAtalonia).BMC Public Health. 2009 Mar 25;9:89. doi: 10.1186/1471-2458-9-89. BMC Public Health. 2009. PMID: 19321009 Free PMC article.
-
New Hypertension After Pregnancy in Patients With Heart Disease.J Am Heart Assoc. 2023 May 16;12(10):e029260. doi: 10.1161/JAHA.122.029260. Epub 2023 May 9. J Am Heart Assoc. 2023. PMID: 37158089 Free PMC article.
-
Hypertension management in Canada: good news, but important challenges remain.CMAJ. 2008 May 20;178(11):1458-60. doi: 10.1503/cmaj.080296. CMAJ. 2008. PMID: 18490641 Free PMC article. No abstract available.
-
Association of urinary sodium excretion with blood pressure and risk factors associated with hypertension among Cameroonian pygmies and bantus: a cross-sectional study.BMC Cardiovasc Disord. 2018 Mar 7;18(1):49. doi: 10.1186/s12872-018-0787-3. BMC Cardiovasc Disord. 2018. PMID: 29514623 Free PMC article.
References
-
- Ezzati M, Lopex AD, Rodgers A, et al. Selected major risk factors and global and regional burden of disease. Lancet 2002;360:1347-60. - PubMed
-
- World Health Organization. The World Health Report 2002. Geneva: The Organization; 2002.
-
- Joffres MR, Ghadirian P, Fodor JG, et al. Awareness, treatment, and control of hypertension in Canada. Am J Hypertens 1997;10:1097-102. - PubMed
-
- Hajjar I, Kotchen TA. Trends in prevalence, awareness, treatment and control of hypertension in the United States, 1988–2000. JAMA 2003;290:199-206. - PubMed
-
- Primatesta P, Poulter NR. Improvement in hypertension management in England: results from the Health Survey for England 2003. J Hypertens 2006;24:1187-92. - PubMed
Publication types
MeSH terms
LinkOut - more resources
Full Text Sources
Medical
Molecular Biology Databases