

High-resolution distance mapping in rhodopsin reveals the pattern of helix movement due to activation
- PMID: 18490656
- PMCID: PMC2396682
- DOI: 10.1073/pnas.0802515105
High-resolution distance mapping in rhodopsin reveals the pattern of helix movement due to activation
Abstract
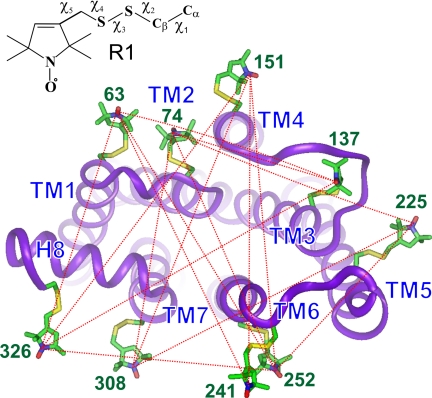
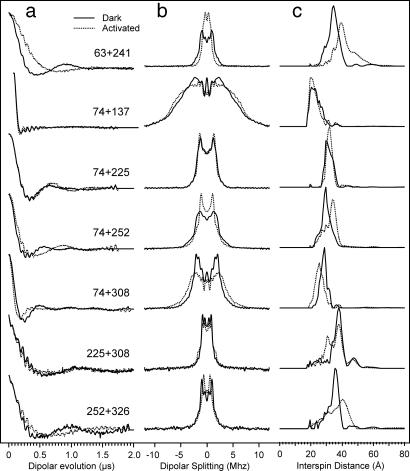
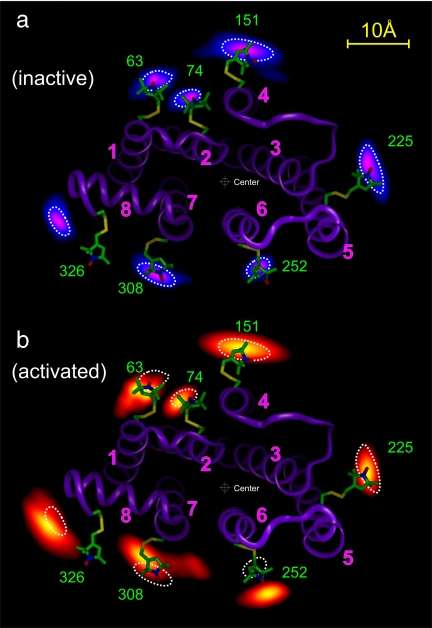
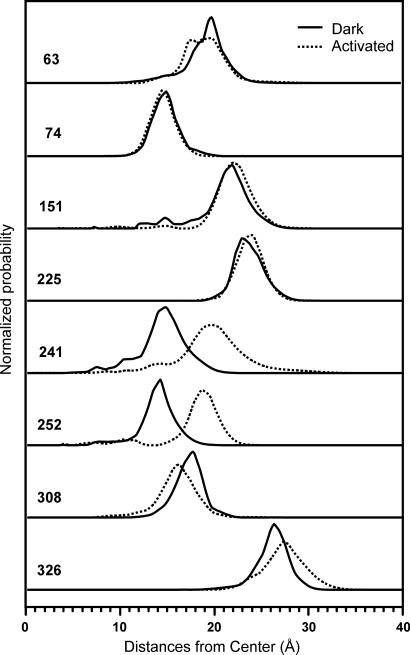
Site-directed spin labeling has qualitatively shown that a key event during activation of rhodopsin is a rigid-body movement of transmembrane helix 6 (TM6) at the cytoplasmic surface of the molecule. To place this result on a quantitative footing, and to identify movements of other helices upon photoactivation, double electron-electron resonance (DEER) spectroscopy was used to determine distances and distance changes between pairs of nitroxide side chains introduced in helices at the cytoplasmic surface of rhodopsin. Sixteen pairs were selected from a set of nine individual sites, each located on the solvent exposed surface of the protein where structural perturbation due to the presence of the label is minimized. Importantly, the EPR spectra of the labeled proteins change little or not at all upon photoactivation, suggesting that rigid-body motions of helices rather than rearrangement of the nitroxide side chains are responsible for observed distance changes. For inactive rhodopsin, it was possible to find a globally minimized arrangement of nitroxide locations that simultaneously satisfied the crystal structure of rhodopsin (Protein Data Bank entry 1GZM), the experimentally measured distance data, and the known rotamers of the nitroxide side chain. A similar analysis of the data for activated rhodopsin yielded a new geometry consistent with a 5-A outward movement of TM6 and smaller movements involving TM1, TM7, and the C-terminal sequence following helix H8. The positions of nitroxides in other helices at the cytoplasmic surface remained largely unchanged.
Conflict of interest statement
The authors declare no conflict of interest.
Figures
Comment in
-
Rhodopsin's active state is frozen like a DEER in the headlights.Proc Natl Acad Sci U S A. 2008 May 27;105(21):7343-4. doi: 10.1073/pnas.0804122105. Epub 2008 May 20. Proc Natl Acad Sci U S A. 2008. PMID: 18492801 Free PMC article. No abstract available.
References
-
- Johnston C, Siderovski D. Receptor-mediated activation of heterotrimeric G-proteins: Current structural insights. Mol Pharmacol. 2007;72:219–230. - PubMed
-
- Oldham WM, Hamm HE. Heterotrimeric G protein activation by G-protein-coupled receptors. Nat Rev Mol Cell Biol. 2008;9:60–71. - PubMed
-
- Schwartz TW, Frimurer TM, Holst B, Rosenkilde MM, Elling CE. Molecular mechanism of 7TM receptor activation—A global toggle switch model. Annu Rev Pharmacol Toxicol. 2006;46:481–519. - PubMed
-
- Palczewski K, et al. Crystal structure of rhodopsin: A G protein-coupled receptor. Science. 2000;289:739–745. - PubMed
Publication types
MeSH terms
Substances
Grants and funding
LinkOut - more resources
Full Text Sources
Other Literature Sources
