. 2008 Jun 1;180(11):7394-403.
doi: 10.4049/jimmunol.180.11.7394.

B lymphocyte stimulator regulates adaptive immune responses by directly promoting dendritic cell maturation

Affiliations

B lymphocyte stimulator regulates adaptive immune responses by directly promoting dendritic cell maturation

Sook Kyung Chang et al. J Immunol. .

Abstract

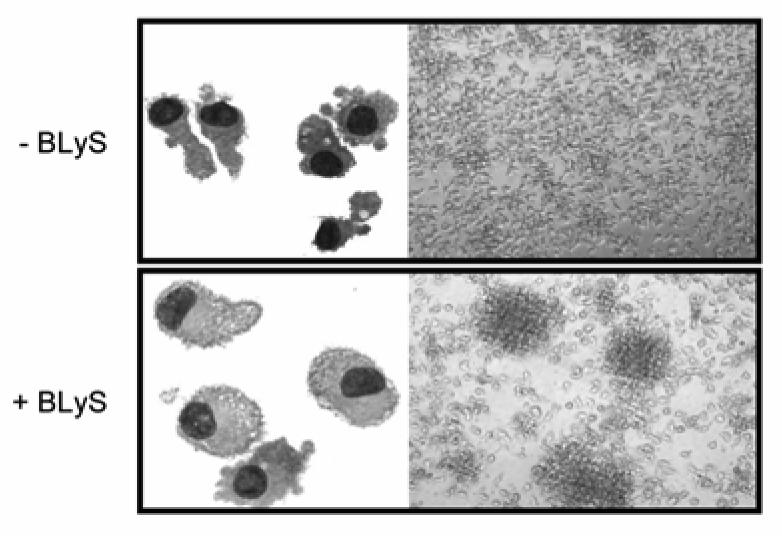
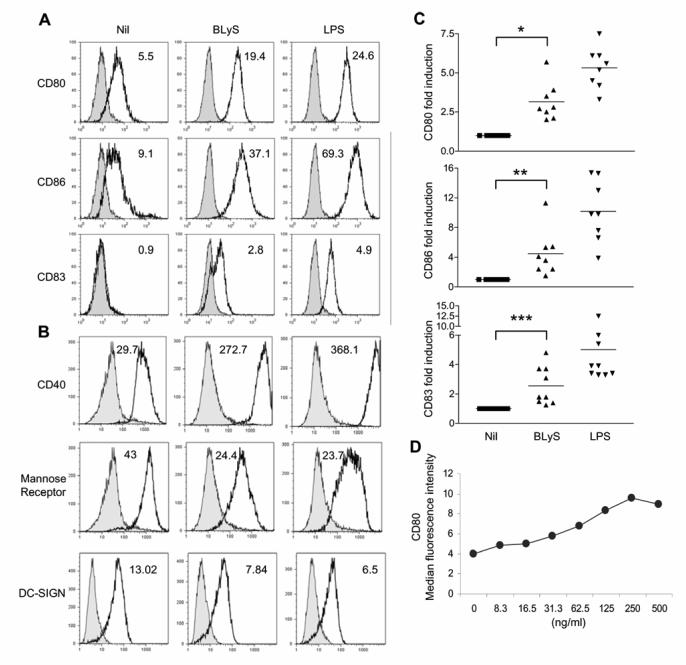
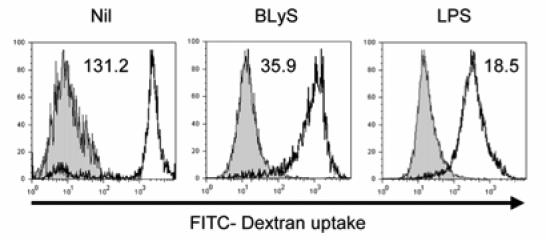
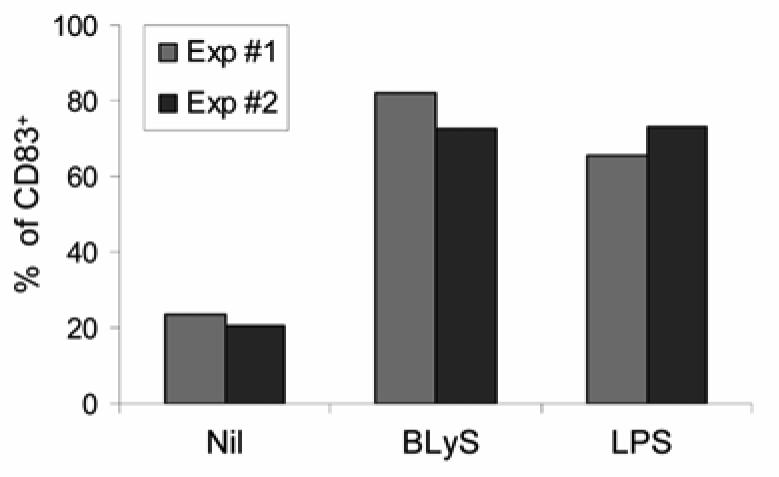
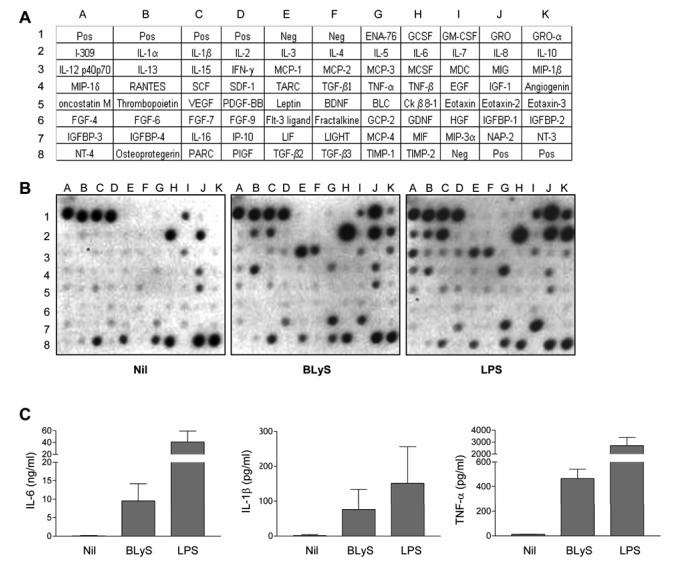
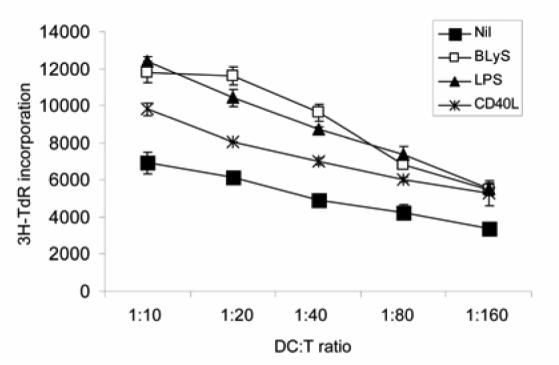
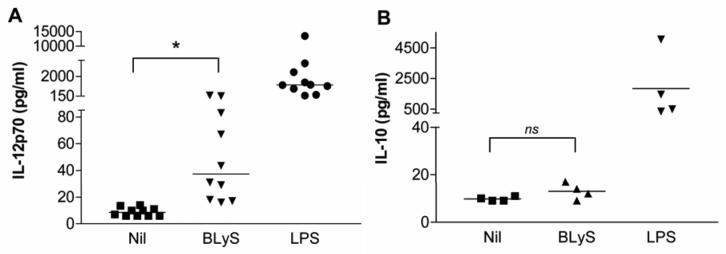
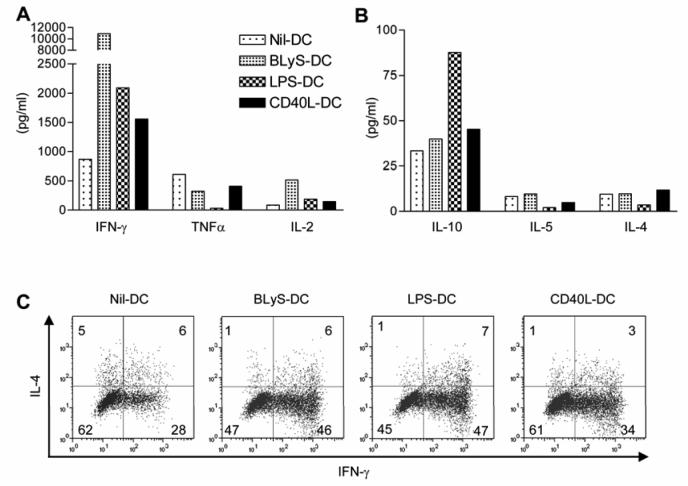
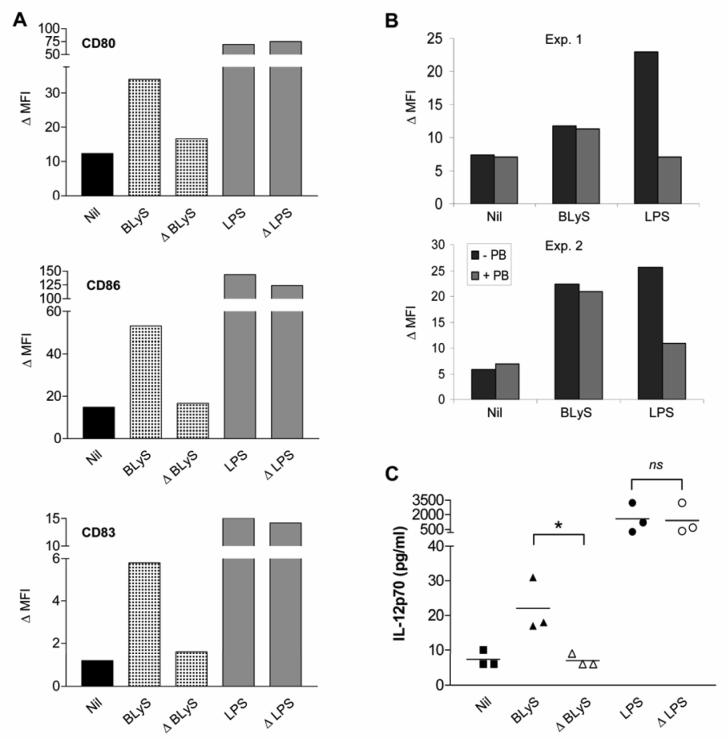
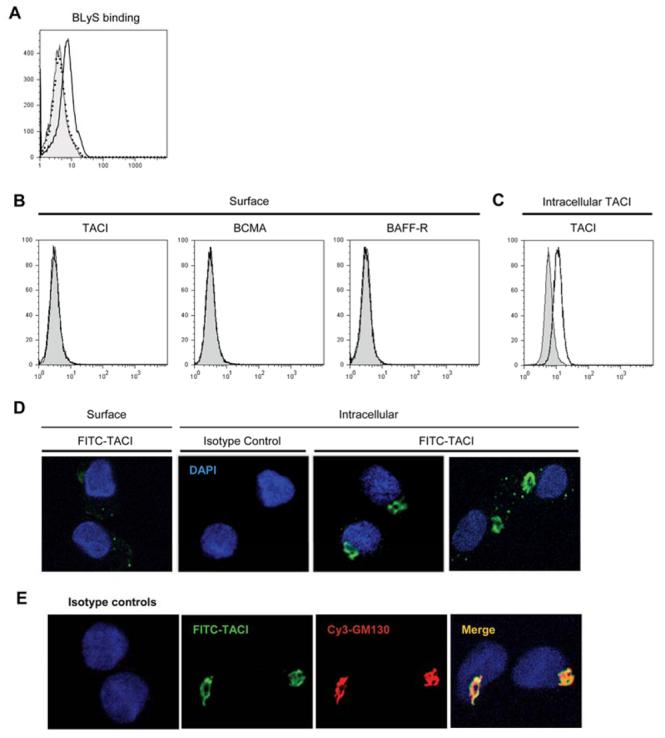
B lymphocyte stimulator (BLyS) is a well-known direct costimulator of adaptive immune cells, particularly B lineage cells. However, we have reported recently that BLyS is also able to activate monocytes. Other innate immune cells, such as dendritic cells (DCs), play a key role in the initiation of adaptive immune responses and the purpose of the current study was to assess whether there is a direct role for BLyS in modulating human DC functions. In this study, we show that BLyS induces DC activation and maturation. Thus, BLyS strongly induced up-regulation of surface costimulatory molecule expression and secretion of specific cytokines and chemokines in DCs. BLyS-stimulated DCs (BLyS-DCs) were also able to augment allogeneic CD4 T cell proliferation to a greater extent than control DCs. BLyS-DCs secreted elevated levels of the major Th1-polarizing cytokine, IL-12p70, and they promoted naive CD4 T cell differentiation into Th1 T cells. Regarding BLyS receptor expression, DCs primarily express cytoplasmic transmembrane activator and CAML interactor; however, low levels of cell surface transmembrane activator and CAML interactor are expressed as well. Collectively, our data suggest that BLyS may modulate adaptive immune cells indirectly by inducing DC maturation.


Figures

FIGURE 1
FIGURE 1. BLyS induces DC morphological changes
Cell morphology was analyzed by Wright-Giemsa staining (left) or light microscopy (right) after a 48h stimulation with or without BLyS in the presence of GM-CSF/ IL-4.
FIGURE 2
FIGURE 2. BLyS promotes DC maturation
A and B. DCs (1×10⁶/ml) were cultured with or without 200 ng/ml BLyS or 20 ng/ml LPS for 24 h, before analysis of expression of the indicated surface molecules on viable cells using flow cytometry. The experiments shown in A and B are representative of 9 and 4 independent experiments, respectively. ΔMFI (delta mean fluorescence intensity), is calculated from the MFI of the cells expressing the marker of interest divided by the MFI of the cells stained with the isotype control, and these numbers are shown in each histogram. C. The fold induction of ΔMFI for CD80, CD86, and CD83 in BLyS or LPS stimulated-DCs as compared with unstimulated DCs is displayed from nine independent experiments. When compared with Nil, *p=0.0002, **p=0.0063, and ***p=0.0022. D. BLyS was titrated over the indicated range of concentrations, and cell surface expression of CD80, as determined by flow cytometry, was determined following a 24 hour stimulation period. The data shown reflect the median CD80 fluorescence intensity observed in a single experiment and are representative of three independent experiments.
FIGURE 3
FIGURE 3. The phagocytic activity is decreased in BLyS-treated DCs
After cells were incubated with FITC-dextran for 2 h at 4°C (filled histogram, control for nonspecific binding) or at 37°C (open histogram), the levels of FITC-dextran uptake were examined by flow cytometry and the ΔMFI was calculated and is indicated on the graphs. The data shown are representative of five independent experiments.
FIGURE 4
FIGURE 4. BLyS promotes blood DC maturation
Freshly isolated blood DCs were cultured with or without 200 ng/ml BLyS or 20 ng/ml LPS for 48 h, and CD83 expression was analyzed by flow cytometry. The graph depicts the percentages of CD83-expressing cells in the CD11c positive population observed following stimulation in two independent experiments (Exp #1 and Exp #2).
FIGURE 5
FIGURE 5. BLyS induces DC cytokine and chemokine production
A. Cytokine array map. B. Cytokine production by BLyS-DCs (200 ng/ml, 24 h) or LPS-DCs (20 ng/ml, 24 h) was compared with unstimulated DCs by using the RayBio Human Cytokine Ab Array IV. One representative out of two independent experiments is shown. C. After stimulating cells with or without 200 ng/ml BLyS or 20 ng/ml LPS for 24 h, cell free supernatants were harvested to determine the levels of IL-6, IL-1β, and TNF-α by ELISA. Data reflect the mean +/- SD of supernatants collected from three independent experiments.
FIGURE 6
FIGURE 6. BLyS-treated DCs enhance T cell proliferation in an allogeneic MLR
After a 24 h stimulation with or without 200 ng/ml BLyS, 100 ng/ml CD40L, or 20 ng/ml LPS, DCs were cocultured with 1×10⁵ freshly isolated allogeneic naive CD4 T cells for 3 days in round-bottomed 96 well plates. Cells were pulsed with 1 µCi [3H]thymidine for the final 16 h, and then [3H]thymidine uptake was measured to determine CD4 T cell proliferation. Data reflect the mean +/- SD of triplicates from one experiment and are representative of six independent experiments.
FIGURE 7
FIGURE 7. BLyS enhances DC IL-12 production, but not IL-10
Immature DCs were incubated with 200 ng/ml BLyS, 20 ng/ml LPS, or without any stimulus for 24 h, and then supernatants were collected to measure IL-12p70 (A) and IL-10 (B) by ELISA. * When compared with Nil, p=0.014.
FIGURE 8
FIGURE 8. BLyS-DCs induce naïve CD4 T cell differentiation into Th1 T cells
After DCs (0.5×10⁵/well) were preactivated with or without 200 ng/ml BLyS, 20 ng/ml LPS, or 100 ng/ml CD40L for 24 h, cells were cocultured with freshly isolated allogeneic naïve CD4 T cells (2.5×10⁵/well) for 2 days in round-bottomed 96 well plates. Culture supernatants were collected and Th1/Th2 cytokine production was measured using a human CBA (A and B). Data are representative of four independent experiments. C. DCs were pre-activated with or without 200 ng/ml BLyS, 100 ng/ml LPS, or 200 ng/ml CD40L for 24 h. After three washes, DCs (0.2×10⁵/well) were cocultured with purified allogeneic naïve CD4 T cells (1×10⁵/ well) for 5 days in flat-bottomed 96 well plates. On day 5, cells were restimulated with PMA plus ionomycin in the presence of brefeldin A for the last 4 h of culture, and cells were analyzed for intracellular IFN-γ and IL-4 staining using flow cytometry.
FIGURE 9
FIGURE 9. BLyS-induced maturation of DCs is not caused by endotoxin contamination
Cells were cultured with control or heat-inactivated BLyS (ΔBLyS, 200 ng/ml) or LPS (ΔLPS, 20 ng/ml) for 24 h. A. Cells were analyzed for cell surface molecule expression by flow cytometry and the ΔMFI is indicated. Data are representative of four independent experiments. B. BLyS or LPS were pretreated with PB (20 µg/ml) for 20 min at room temperature, and then added into cells. Surface CD80 expression was measured. Data shown are from two independent experiments. C. Cell-free supernatants were analyzed for IL-12p70 by ELISA. * When compared with Nil, p=0.031.
FIGURE 10
FIGURE 10. BLyS receptor expression
A. Soluble BLyS binding was determined by flow cytometry. DCs were incubated with (open histogram) or without (filled histogram) 2 μg/ml soluble BLyS for 2 h at 37°C, washed, incubated with biotinylated anti-BLyS antibody, and stained with streptavidin-conjugated PE. Isotype control was indicated by the dotted histogram. B. Surface staining of TACI, BCMA, and BAFF-R. C. Intracellular TACI staining. Specific receptor expression was indicated by the open histograms and isotype and fluorescence controls were indicated by the filled histograms. D. Subcellular localization of TACI in DCs by confocal immunofluorescence microscopy. Surface and intracellular TACI expression was assessed using a TACI specific goat antibody. E. Cells were costained with anti-TACI and anti-GM130 antibodies. Colocalization was confirmed when the images were merged (right panel). Isotype matched control primary antibody staining is also shown in D and E.

References

    1. Banchereau J, Briere F, Caux C, Davoust J, Lebecque S, Liu YJ, Pulendran B, Palucka K. Immunobiology of dendritic cells. Annu Rev Immunol. 2000;18:767–811. - PubMed
    1. Lanzavecchia A, Sallusto F. Regulation of T cell immunity by dendritic cells. Cell. 2001;106:263–266. - PubMed
    1. Steinman RM. The dendritic cell system and its role in immunogenicity. Annu Rev Immunol. 1991;9:271–296. - PubMed
    1. Moser M, Murphy KM. Dendritic cell regulation of TH1-TH2 development. Nat Immunol. 2000;1:199–205. - PubMed
    1. Chen M, Wang YH, Wang Y, Huang L, Sandoval H, Liu YJ, Wang J. Dendritic cell apoptosis in the maintenance of immune tolerance. Science. 2006;311:1160–1164. - PubMed

Publication types

MeSH terms