. 2008 Jun 1;180(11):7443-50.
doi: 10.4049/jimmunol.180.11.7443.

Requirement for enhancer specificity in immunoglobulin heavy chain locus regulation

Affiliations

Requirement for enhancer specificity in immunoglobulin heavy chain locus regulation

Igor I Kuzin et al. J Immunol. .

Abstract

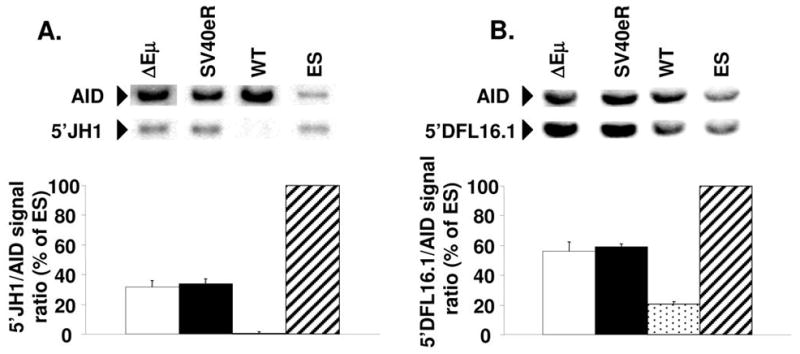
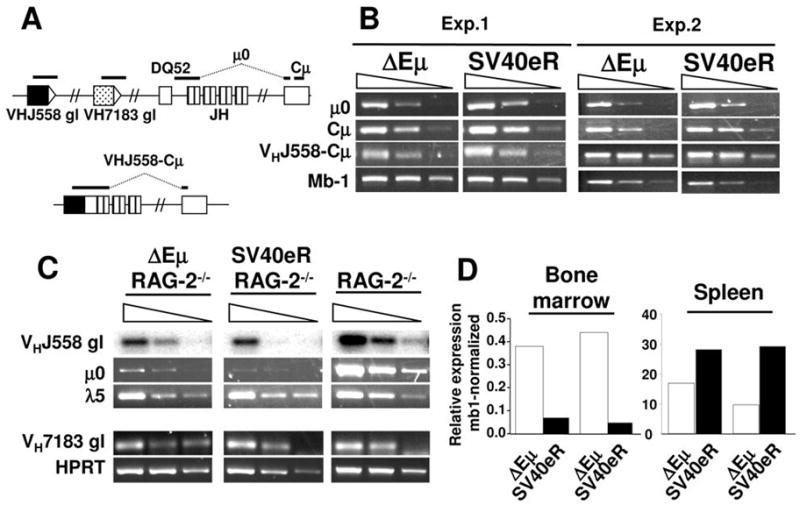
The intronic Emicro enhancer has been implicated in IgH locus transcription, VDJ recombination, class switch recombination, and somatic hypermutation. How Emicro controls these diverse mechanisms is still largely unclear, but transcriptional enhancer activity is thought to play a central role. In this study we compare the phenotype of mice lacking the Emicro element (DeltaEmicro) with that of mice in which Emu was replaced with the ubiquitous SV40 transcriptional enhancer (SV40eR mutation) and show that SV40e cannot functionally complement Emu loss in pro-B cells. Surprisingly, in fact, the SV40eR mutation yields a more profound defect than DeltaEmicro, with an almost complete block in micro0 germline transcription in pro-B cells. This active transcriptional suppression caused by enhancer replacement appears to be specific to the early stages of B cell development, as mature SV40eR B cells express micro0 transcripts at higher levels than DeltaEmicro mice and undergo complete DNA demethylation at the IgH locus. These results indicate an unexpectedly stringent, developmentally restricted requirement for enhancer specificity in regulating IgH function during the early phases of B cell differentiation, consistent with the view that coordination of multiple independent regulatory mechanisms and elements is essential for locus activation and VDJ recombination.


Figures

Figure 1
Figure 1. Targeting and screening strategy
A. Maps of the IgH locus and targeting constructs. Relevant restriction enzyme sites (R, EcoRI; B, BamHI; S, SspI; P, PpuMI; H, HindIII) are indicated. 1. Structure of the endogenous IgH locus, with the position of DQ52 and JH segments, Eμ core (filled circle) and MARs (gray boxes), and Cμ exons 1 and 2. 2. Targeting construct for the ΔEμ mutation, with LoxP sites (striped boxes) flanking a G418-resistance marker (neo), and a thymidine kinase negative selection marker (tk) outside of the 3′ homology arm. The site of insertion of the SV40 enhancer (SV40e, open oval) is marked. 3. Structure of the ΔEμ targeted locus (site of insertion of the SV40e in the SV40eR mutants is indicated below). PCR primers used for screening for germline transmission (PGK-F and Smu-B, Table I) are indicated by arrows. 4. Structure of the ΔEμ targeted locus after Cre-mediated deletion of the neo gene (site of insertion of the SV40e in the SV40eR mutants is indicated below). PCR primers used for screening for deletion (UDEμ-F and UDEμ-B, Table I) are indicated by arrows. B. Southern blot analysis of targeted ΔEμ (left) and SV40eR (right) ES cell clones. Genomic DNAs were digested with BamHI and hybridized with the 5′Cμ probe (position shown in A.1. above). IgH a and b alleles in F1.11 cells generate fragments of about 8 and 9 kb, respectively, while successful integration of the targeting construct gene results in insertion of a new BamHI site and generates bands of 7.5 kb. C. PCR screening for germline transmission of the ΔEμ-neo and SV40eR-neo mutations. Wild-type alleles do not amplify with the PGK-F and Smu-B primer pair, since the former maps to the neo marker and the latter is outside the construct homology region. D. PCR screening for Cre-mediated neo deletion. Using the UDEμ-F and UDEμ-B primer pair, wild-type alleles give rise to a 393 bp band, ΔEμ alleles to a 283 bp band and SV40eR to a 503 bp band.
Figure 2
Figure 2. Flow cytometry of B cell populations in ΔEμ and SV40eR mice
Bone marrow (BM, top panels) and spleen (bottom panels) cells from ΔEμ, SV40eR and control mice were analyzed by flow cytometry with the indicated antibodies. B220-low, CD2+ pre-B cells were significantly decreased in both mutants strains and were mature B220+, IgM+ cells in the spleen. Data are representative of 5–10 mice/strain.
Figure 3
Figure 3. Analysis of IgH rearrangement in ΔEμ and SV40eR mice
Genomic DNA from day-4 LPS-stimulated B cell cultures from mutant and wild-type mice and from parental E2-1 ES cells were digested with Hind III, blotted and hybridized with probes for AID and a region upstream of JH1 (A), or digested with EcoRI, blotted and hybridized with probes for AID and a region upstream of DFL16.1 (B). Each experimental lane contained DNA from 2 pooled parallel cultures after magnetically sorting for CD19+ cells and Ficoll gradient purification of dead cells. The graphs show averages and standard deviations from 3 independent experiments (6 experimental mice). Hybridization signals from AID and IgH sequences were quantified using ImageQuant software after exposure to fluorescent screens, the signal ratios of IgH/AID in each lane was calculated and normalized to ES cell signal ratio (100% retention because of lack of rearrangement). Note the almost complete D-JH rearrangement of non-expressed alleles in wild-type cells (about 0% residual signal for 5′JH1) vs about 30% 5′JH1 retention in ΔEμ and SV40eR cells (A). Similarly, ΔEμ and SV40eR non-expressed alleles show almost complete lack of VH-DJ rearrangement (about 50% retention of 5′DFL16.1 signal) while wild-type alleles show substantial VH-DJ rearrangement (20% 5′DFL16.1 retention, 60% rearrangement).
Figure 4
Figure 4. IgH germline transcript expression in ΔEμ and SV40eR mice
A. Schematics of the location of transcripts analyzed by RT-PCR in these experiments (not in scale). Top, germline region, bottom, rearranged J558 region. Note that the μ0 and VHJ558-Cμ transcripts amplified regions span spliced exons. B. RT-PCR analysis of IgH transcripts in CD19-purified mature splenic B cells. Serial 10-fold dilutions of cDNA samples were analyzed with the following primer pairs, μ0: Mu0 and GLμR; Cμ: CμAH-F and CμAH-B; VHJ558-Cμ, VHJ558S and GLμR; Mb-1, Mb1-F and Mb1-B (see also Table I). Two of 3 independent experiments are shown. C. RT-PCR analysis of IgH transcripts in bone marrow pro-B cells of ΔEμ/RAG2−/−, SV40eR/RAG2−/− and RAG2−/− controls. Primer pairs were: μ0: Mu0 and GLμR; germline VHJ558: VHJ558 and J558Sp2; l5: λ5-F and λ5-B (Table I). VHJ558 germline transcripts RT-PCR products were blotted and hybridized with internal J558-specific oligonucleotide probe VHJ558Sc. D. qPCR analysis of μ0 expression in SV40eR and ΔEμ bone marrow (left) and spleen (right) samples, obtained as described in panels A and B. Note how SV40eR alleles express 7- to 10-fold lower μ0 transcripts compared to ΔEμ in the bone marrow, but 1.7–3 fold higher levels in mature B cells.
Figure 5
Figure 5. IgH locus DNA methylation in ΔEμ and SV40eR B cells
IgH locus DNA methylation was analyzed by digestion of genomic DNAs from the indicated sources with Hind III alone, or HindIII and either MspI or its methylation-sensitive isoschizomere HpaII. Resistance to digestion with HpaII compared to MspI indicates methylation of the site. A. Map of the relevant sites in the wild-type and mutant IgH loci (H, HindIII; M/H, MspI/HpaII, not in scale) and probes position. B. Southern blot analysis of DNA from cells harvested from IL7-supplemented LTBMCs of the indicated mice (>95% B220+, CD43+ pro-B cells). Blots were sequentially hybridized with probes spanning either the entire DQ52-JH1 region (top) or the Iμ exon (bottom). Unlike IgH-wild-type B cells, both SV40eR and ΔEμ alleles show only limited demethylation at the JH locus. C. Southern blot analysis of DNA from magnetically sorted CD19+ LPS-stimulated splenic B cells from the indicated mice (>95% B220+ B cells). Digestion patterns are as indicated in panel C. Blots were sequentially hybridized with a probe spanning either the DQ52-JH1 interval (to avoid hybridization with DQ52-JH rearranged alleles) (top panel) or the Iμ exon (bottom panel). Both SV40eR and wild-type alleles are completely demethylated and both JH and Iμ-proximal sites, while ΔEμ alleles show incomplete, although significant, demethylation. Note that the wild-type sample shows little DQ52-JH signal because of almost complete deletion of this region by VDJ rearrangement. 1 of 2 independent experiments shown.

Similar articles

Cited by

References

    1. Ernst P, Smale ST. Combinatorial regulation of transcription II: The immunoglobulin mu heavy chain gene. Immunity. 1995;2:427–438. - PubMed
    1. Serwe M, Sablitzky F. V(D)J recombination in B cells is impaired but not blocked by targeted deletion of the immunoglobulin heavy chain intron enhancer. Embo J. 1993;12:2321–2327. - PMC - PubMed
    1. Chen J, Young F, Bottaro A, Stewart V, Smith RK, Alt FW. Mutations of the intronic IgH enhancer and its flanking sequences differentially affect accessibility of the JH locus. Embo J. 1993;12:4635–4645. - PMC - PubMed
    1. Bottaro A, Young F, Chen J, Serwe M, Sablitzky F, Alt FW. Deletion of the IgH intronic enhancer and associated matrix-attachment regions decreases, but does not abolish, class switching at the mu locus. Int Immunol. 1998;10:799–806. - PubMed
    1. Sakai E, Bottaro A, Davidson L, Sleckman BP, Alt FW. Recombination and transcription of the endogenous Ig heavy chain locus is effected by the Ig heavy chain intronic enhancer core region in the absence of the matrix attachment regions. Proc Natl Acad Sci U S A. 1999;96:1526–1531. - PMC - PubMed

Publication types

MeSH terms

Substances