. 2008 Jun 1;180(11):7553-7.
doi: 10.4049/jimmunol.180.11.7553.

PDL-1 blockade impedes T cell expansion and protective immunity primed by attenuated Listeria monocytogenes

Affiliations

PDL-1 blockade impedes T cell expansion and protective immunity primed by attenuated Listeria monocytogenes

Jared H Rowe et al. J Immunol. .

Abstract

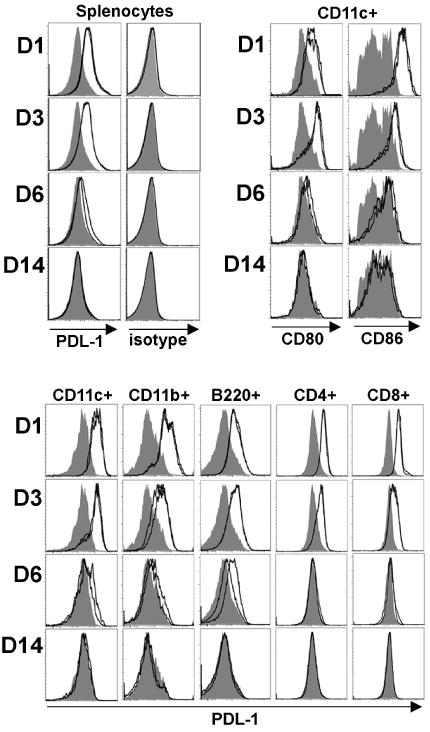
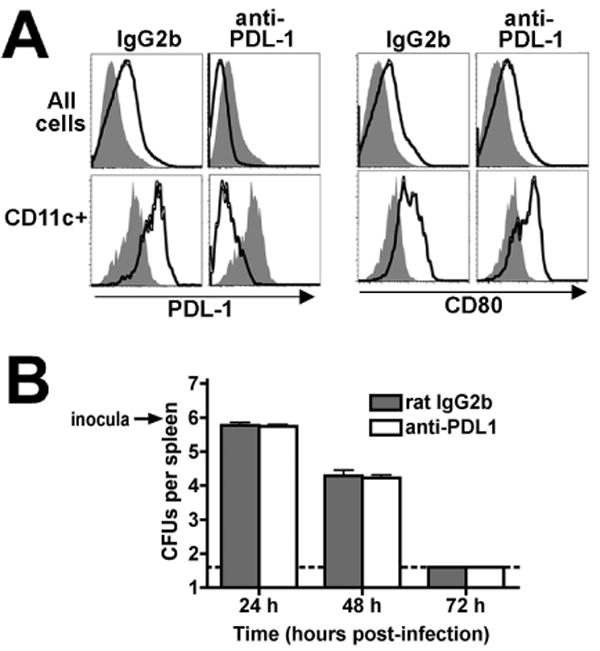
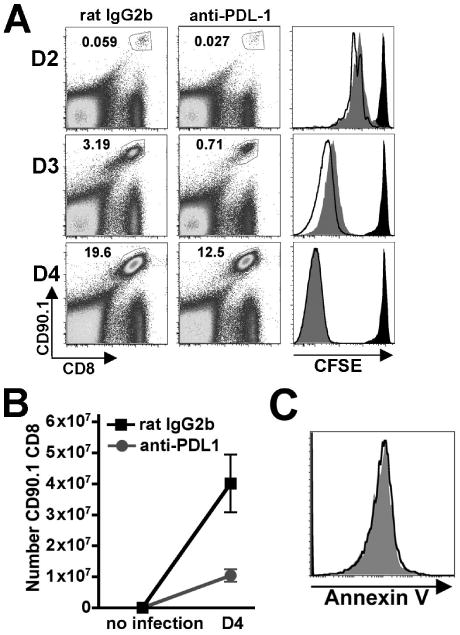
Infection with attenuated Listeria monocytogenes (Lm) is a robust in vivo model for examining how Ag-specific T cells are primed, and subsequent challenge with virulent Lm allows for the protective effects of T cell priming to be quantified. Herein, we investigated the role of programmed death ligand 1 (PDL-1) in T cell priming and immunity conferred after primary infection with Lm DeltaactA followed by virulent Lm challenge. In striking contrast to the inhibitory role of PDL-1 on T cell immunity in other infection models, marked reductions in the magnitude of T cell expansion and the kinetics of T cell proliferation were observed with PDL-1 blockade after primary Lm DeltaactA infection. More importantly, PDL-1 blockade beginning before primary infection and maintained throughout the experiment resulted in delayed bacterial clearance and T cell expansion after secondary challenge with virulent Lm. These results indicate that for immunity to intracellular bacterial infection, PDL-1 plays an important stimulatory role for priming and expansion of protective T cells.


Figures

Figure 1
Figure 1
PDL-1, CD80, and CD86 expression among all splenocytes or specific splenocyte cell subsets at the indicated time points after infection with 106 Lm ΔactA (open histograms) compared with no infection mice (shaded histograms). These data are from 2 mice per experimental group per time point, and representative of three independent experiments with similar results.
Figure 2
Figure 2
A. PDL-1 and CD80 expression among all splenocytes (top) or CD11c+ splenocyte cells (bottom) from mice 3 days after infection with 106 Lm ΔactA (open histograms) or no infection (shaded histograms) treated with either rat IgG2b isotype control or anti-PDL-1 antibody prior to infection. These data are from 2 mice per experimental group per time point, and representative of three independent experiments. B. Number of recoverable Lm CFUs per spleen in rat IgG2b control (shaded bars) or anti-PDL-1 antibody (open bars) treated mice at the indicated time points after infection. These data are from 4 to 5 mice per group, reflective of two independent experiments. Bar, one standard error.
Figure 3
Figure 3
A. Percent antigen-specific CD8 T cells among PBMCs in anti-PDL-1 antibody treated and control mice at the indicated time points after infection with 106 Lm ΔactA quantified by H-2Kb OVA257-264 dimer staining. B. Number of H-2Kb OVA257-264 dimer+ CD8 T cells among splenocytes day 8 post-infection. C. Percent and number of IFN-γ producing CD8 T cells among splenocytes after stimulation with OVA257-264 peptide or no stimulation day 8 post-infection. D. Percent and number of IFN-γ producing CD4 T cells among splenocytes after LLO189-201 peptide stimulation day 8 post-infection. These data represent 7 to 12 mice per experimental group and is representative of three independent determinations. Bar, standard error. * P < 0.05.
Figure 4
Figure 4
A. Expansion and CFSE dilution in adoptively transferred OT-I (CD90.1+CD8+) cells at the indicated time points after infection with 106 Lm ΔactA in anti-PDL-1 antibody treated (gray histograms), control rat IgG2b treated (open histograms), or no infection control mice (black histograms). The numbers in the upper left quadrant indicate percentage of gated cells among total splenocytes. B. Number of OT-I (CD90.1+CD8+) per mouse spleen prior to infection and day 4 after infection in anti-PDL-1 antibody (circle) or rat IgG2b antibody (square) treated mice. C. Annexin V staining among OT-1 (CD90.1+CD8+) cells day 3 after infection in either anti-PDL-1 treated (gray histograms) or control IgG2b treated (open histograms) mice. These data represent 5-7 mice for each experimental group combined from two independent experiments. Bar, standard error.
Figure 5
Figure 5
A. Numbers of recoverable Lm CFUs in the liver days 3 and 5 after challenge with 105 virulent Lm for the indicated groups of naive mice (solid bar), or mice previously inoculated with Lm ΔactA 30 days prior to challenge (shaded and striped bars). For these experiments, mice were treated with either anti-PDL-1 or control antibody prior to primary infection, and throughout the experiment as described in the Materials and Methods. B. Number of IFN-γ producing CD8 T cells after stimulation with OVA257-264 peptide among splenocytes prior to challenge (day 30 after Lm ΔactA infection), and days 3 and 5 after challenge with virulent Lm. These data represent 7 mice for each experimental group combined from two independent experiments. Bar, standard error. * P < 0.05.

References

    1. Keir ME, Francisco LM, Sharpe AH. PaD-1 and its ligands in T-cell immunity. Curr Opin Immunol. 2007;19:309–314. - PubMed
    1. Sharpe AH, Wherry EJ, Ahmed R, Freeman GJ. The function of programmed cell death 1 and its ligands in regulating autoimmunity and infection. Nat Immunol. 2007;8:239–245. - PubMed
    1. Dong H, Zhu G, Tamada K, Chen L. B7-H1, a third member of the B7 family, co-stimulates T-cell proliferation and interleukin-10 secretion. Nat Med. 1999;5:1365–1369. - PubMed
    1. Kanai T, Totsuka T, Uraushihara K, Makita S, Nakamura T, Koganei K, Fukushima T, Akiba H, Yagita H, Okumura K, Machida U, Iwai H, Azuma M, Chen L, Watanabe M. Blockade of B7-H1 suppresses the development of chronic intestinal inflammation. J Immunol. 2003;171:4156–4163. - PubMed
    1. Subudhi SK, Zhou P, Yerian LM, Chin RK, Lo JC, Anders RA, Sun Y, Chen L, Wang Y, Alegre ML, Fu YX. Local expression of B7-H1 promotes organ-specific autoimmunity and transplant rejection. J Clin Invest. 2004;113:694–700. - PMC - PubMed

Publication types

MeSH terms