. 2008 Jun;98(6):561-77.
doi: 10.1007/s00422-008-0219-z. Epub 2008 May 20.

Linear ensemble-coding in midbrain superior colliculus specifies the saccade kinematics

Affiliations

Linear ensemble-coding in midbrain superior colliculus specifies the saccade kinematics

A J van Opstal et al. Biol Cybern. 2008 Jun.

Abstract

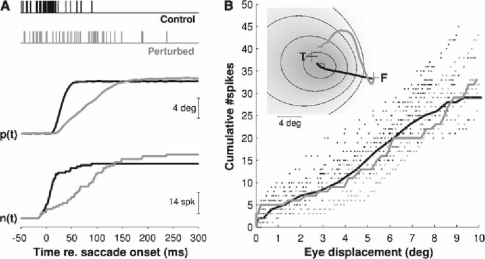
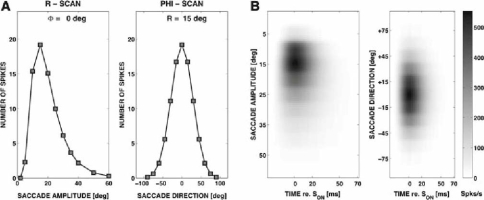
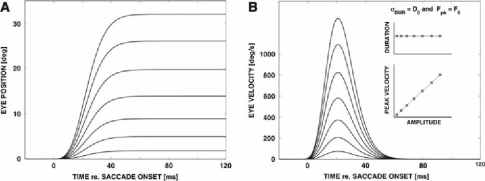
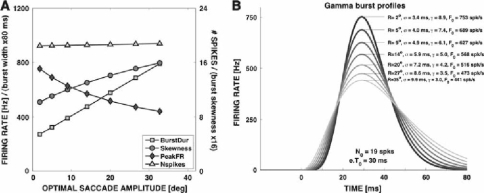
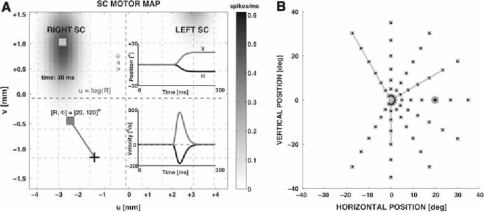
Recently, we proposed an ensemble-coding scheme of the midbrain superior colliculus (SC) in which, during a saccade, each spike emitted by each recruited SC neuron contributes a fixed minivector to the gaze-control motor output. The size and direction of this 'spike vector' depend exclusively on a cell's location within the SC motor map (Goossens and Van Opstal, in J Neurophysiol 95: 2326-2341, 2006). According to this simple scheme, the planned saccade trajectory results from instantaneous linear summation of all spike vectors across the motor map. In our simulations with this model, the brainstem saccade generator was simplified by a linear feedback system, rendering the total model (which has only three free parameters) essentially linear. Interestingly, when this scheme was applied to actually recorded spike trains from 139 saccade-related SC neurons, measured during thousands of eye movements to single visual targets, straight saccades resulted with the correct velocity profiles and nonlinear kinematic relations ('main sequence properties' and 'component stretching'). Hence, we concluded that the kinematic nonlinearity of saccades resides in the spatial-temporal distribution of SC activity, rather than in the brainstem burst generator. The latter is generally assumed in models of the saccadic system. Here we analyze how this behaviour might emerge from this simple scheme. In addition, we will show new experimental evidence in support of the proposed mechanism.


Figures

Fig. 1
Fig. 1
Properties of visually-evoked saccades. Left The main sequence (NL). Dotted lines (L) indicate responses for a hypothetical linear system. Center Skewness of saccade velocity profiles increases with saccade duration. Right. Component stretching. Here, an oblique saccade in a direction 60 deg re. horizontal (formula image) has components with very different amplitudes, but velocity profiles bottom with equal durations and similar shapes. The pure horizontal saccade (formula image) has a much shorter duration and higher velocity (formula image) than the equally large horizontal component of the oblique saccade (formula image)
Fig. 2
Fig. 2
Movement field of superior colliculus neuron pj9003. a Instantaneous firing rate (gray scale) as function of time, for saccades through the center of its movement field, sorted for different amplitudes (amplitude scan). Tick marks indicate spike-counting windows for saccaderelated burst (20ms before saccade onset to 20ms before offset). Gray trace is the average eye position for the cell’s optimal visually-evoked saccade. Black trace corresponds to the average saccade elicited by micro-stimulation at the recording site. Note close correspondence. b Same for a direction scan through the movement field center. Velocity profiles of the saccades are superimposed. c Spatial extent of the movement field. Gray scale is number of spikes in the burst. Contour lines drawn at [0.5, 1.0, 1.5 and 2]·σ pop. Circles denote saccade end points shown in the left panels. Black trace is the average stimulation-induced saccade trajectory, which ends closely to the center of the movement field. d Close correspondence between the optimal saccade vectors of 13 different cells and the fixed-vector stimulation-induced saccades at the recording sites
Fig. 3
Fig. 3
Responses of SC neuron er0902 for 10 deg saccades illustrating the results obtained with the blink perturbation paradigm. a Discharge pattern during a typical control and perturbation trial together with corresponding traces of eye displacement, p(t), and cumulative number of spikes, n(t), as a function of time. p(t) is the instantaneous eye-displacement component in the direction of the saccade vector formula image, given by: formula image. b Delayed (20 ms) cumulative spike counts as function of eye displacement, p(t). Dots are data from additional control and perturbation trials. Inset: 2D saccade trajectories of (a) superimposed on the cell’s movement field. Note robust changes in eye velocity, saccade duration and 2D trajectories as well as in mean and peak firing rates and burst duration. Only saccade accuracy and numbers of spikes in burst remained unaffected. Also note that the response curves for control and perturbed saccades in (b) follow very similar and roughly linear trajectories. Thus the firing patterns of this cell reflected neither the curvature of the eye movement nor the subsequent compensatory phase, but were faithfully related to the intended straight (1D) eye displacement trajectory. Comparable results were obtained for all 25 neurons that could be fully tested with this paradigm (Goossens and Van Opstal 2006)
Fig. 4
Fig. 4
Reconstruction of saccades from measured SC activity patterns.a Linear 2D model of the SC brainstem saccade generator. In this model, each spike from each cell k contributes a tiny “spike vector”, formula image, to the eye displacement command. The instantaneous sum of spike vectors from all cells in the active population thus represents a vectorial velocity pulse. Dots in the SC map indicate locations of recorded and mirror-reflected cells. NI, neural integrator; MN, motor neurons. b Raw discharge patterns of all SC cells for a rightward saccade of ∼20 deg applied to the model. The reconstruction produced a realistic saccadic profile that closely matched the (average) measured saccade. Insets show maps of instantaneous firing rates in the contralateral SC (bottom) and distribution of activity along its rostral-to-caudal axis (left; 0mm corresponds to rostral pole) at different moments in time. c,d Reconstructions generated realistic eye displacement and velocity profiles for saccades of different amplitudes (R ∈ [7,11,16,21,32]°;Φ = 30°). e The horizontal and vertical saccade components show the correct amount of “stretching” needed to obtain straight saccades in all directions, even though the scheme does not assume the planning of a straight saccade. It is a “multiple source” model with independent horizontal and vertical burst generators. f Reconstructed saccades showed the same nonlinear, saturating amplitude-peak velocity relation (“main sequence”) as the measured saccades, even though the brainstem circuit in the model is entirely linear
Fig. 5
Fig. 5
Movement field of a SC model cell with an optimal saccade vector of [R,Φ] = [15, 0] deg. a Left: Total number of spikes in the gamma-burst as function of saccade amplitude (direction 0 deg); right: number of spikes as function of saccade direction (amplitude 15 deg).As a result of the logarithmic compression of the motor map, the amplitude tuning curve is asymmetric, in contrast to the direction tuning curve. b Gamma-burst activity profiles for the amplitude (left) and direction (right) scans. Scale: firing rate in spikes/s
Fig. 6
Fig. 6
The model behaves as a linear system, when the temporal burst profiles have fixed parameters. a Eye position traces. b Velocity profiles scale linearly with saccade amplitude. Inset: main sequence
Fig. 7
Fig. 7
Burst properties of SC saccade-related cells. Cells (N=77) were selected for having at least five saccades into the center of their movement field (within 0.5σpop). Highlighted cells (n = 32) are selected for producing N 0 = 20 spikes for their optimal saccade. a Top: Number of spikes is not related to the optimal saccade amplitude. Bottom: Peak firing rate of the spike-density function, however, decreases systematically as function of a cell’s optimal amplitude b Average spike-density burst profiles (peaks normalised) for the four clusters of cells show a clear increase of burst duration (and skewness) with saccade amplitude. Inset: average optimal radial saccade position—and velocity traces for the four cell groups. Note main-sequence behaviour and skewness
Fig. 8
Fig. 8
a Peak firing rate, burst duration (width, σ Dur; left axis), the number of spikes, and burst skewness (right axis) of each model cell as function of its optimal saccade amplitude (Eqs. 14–15). b Examples of SC gamma bursts with the properties shown in a
Fig. 9
Fig. 9
a Snapshot of the model’s activity in the motor map for a leftupward saccade at [R,Φ] = [20, 120] deg. Insets in this panel show horizontal and vertical eye-position traces (top-right), eye-velocity profiles (bottom-right; note component stretching), and the associated 2D trajectory (bottom-left). The activity snapshot was taken at the moment of maximum firing of the gamma burst activity profiles (30 ms after burst onset). Note that activity is divided across the two motor maps. Grid superimposed on the anatomical [u,v] coordinates shows iso-amplitude (running vertical, at R= 0, 2, 5, 20, 50 deg) and iso-direction (running horizontal, Φ = −90,−60,−30, 0, 30, 60, 90 deg) lines of the motor map (Eq. 11). The u = 0 line in the center separates the two colliculi. b Targets (squares) and model saccade endpoints (black dots) for 63 locations. The target at (20,0) deg (highlighted) was used to tune the model’s weighting constant to η = 0.00039. Three example trajectories are also shown (gray lines)
Fig. 10
Fig. 10
Traces of eye position a and eye velocity b for simulated horizontal saccades to targets at R = [2, 5, 9, 14, 27, 35]deg eccentricity. Note the asymmetric shape of the velocity profiles, which is due to a fixed acceleration time (determined by e · T 0 = 30 ms, Eq. 14). The main sequence for these saccades is shown in the insets of panel b
Fig. 11
Fig. 11
a Cell activity during saccades into (gray symbols) and out of (black dots) the center of its movement field (centered at [R,Φ] = [10, 0] deg). Saccade amplitudes varied from R = [2, 5, 10, 15, 20, 25, 30, 35] deg. The cumulative spike count is shown as function of the instantaneous eye displacement; individual dots correspond to time samples, not spikes. The cell’s burst duration (and hence its peak mean firing rate) depended on saccade amplitude, R (Eq. 15, σ 0 = 3 ms; β = 0.07 ms/deg). The phase plots are straight, even for the saccades with a low number of spikes, and their slopes depend systematically on the saccade vector (Eq. 10). b Same plots for slow saccades, simulated by setting β = 0.25 ms/deg. The phase plots of slow saccades are indistinguishable from the fast saccades in a. c Fast and slow eye displacements of 10 deg. The inset shows the corresponding burst profiles for this cell taking part in these saccades. d Cumulative spike counts of fast (gray) and slow(black) saccades follow different dynamics, because of different saccade kinematics
Fig. 12
Fig. 12
Simulations with the center-of-gravity model (Eqs. 17–18). a Phase plots for the optimal saccade of different cells are not straight. Inset: brainstem burst generator nonlinearity. b The nonlinear model also fails to explain the invariant phase plots for fast (gray line) and slow (dotted, black) saccades, here illustrated for the cell at the R=10 deg site. Insets: gamma bursts for fast and slow 10 deg saccades (left); dynamic burst generator nonlinearity (right). See text for explanation

Similar articles

Cited by

References

    1. Arai K, Keller EL. A model of the saccade-generating system that accounts for trajectory variations produced by competing visual stimuli. Biol Cybern. 2005;92:21–37. doi: 10.1007/s00422-004-0526-y. - DOI - PubMed
    1. Bahill AT, Clark MR, Stark L. The main sequence, a tool for studying human eye movements. Math Biosci. 1977;24:191–204. doi: 10.1016/0025-5564(75)90075-9. - DOI
    1. Berthoz A, Grantyn A, Droulez J. Some collicular efferent neurons code saccadic eye velocity. Neurosc Lett. 1986;72:289–294. doi: 10.1016/0304-3940(86)90528-8. - DOI - PubMed
    1. Crawford JD, Guitton D. Visual-motor transformations required for accurate and kinematically correct saccades. J Neurophysiol. 1997;78:1447–1467. - PubMed
    1. Evinger C, Kaneko CR, Fuchs AF. Oblique saccadic eye movements of the cat. Exp Brain Res. 1981;41:370–379. doi: 10.1007/BF00238895. - DOI - PubMed

Publication types