Comparative Study
. 2009 Jan;29(1):63-72.
doi: 10.1111/j.1478-3231.2008.01793.x. Epub 2008 May 19.

Curcumin reduces the toxic effects of iron loading in rat liver epithelial cells

Affiliations
Comparative Study

Curcumin reduces the toxic effects of iron loading in rat liver epithelial cells

Donald J Messner et al. Liver Int. 2009 Jan.

Abstract

Background/aims: Iron overload can cause liver toxicity and increase the risk of liver failure or hepatocellular carcinoma in humans. Curcumin (diferuloylmethane), a component of the food spice turmeric, has antioxidant, iron binding and hepatoprotective properties. The aim of this study was to quantify its effects on iron overload and the resulting downstream toxic effects in cultured T51B rat liver epithelial cells.

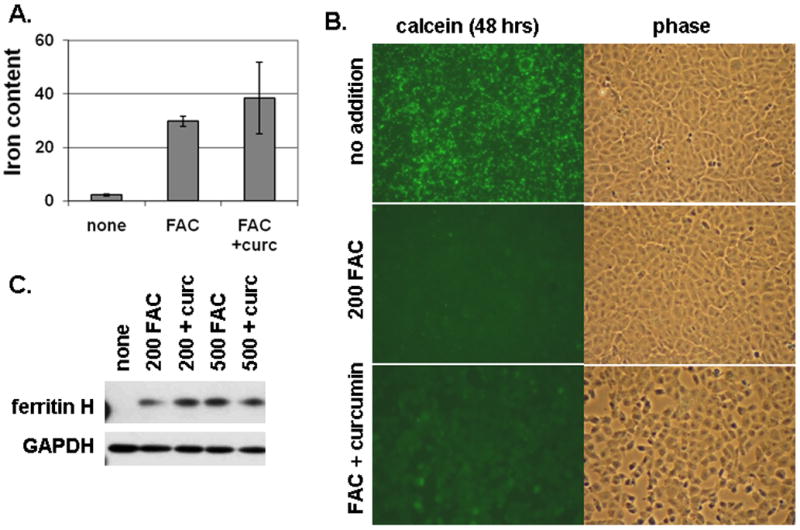
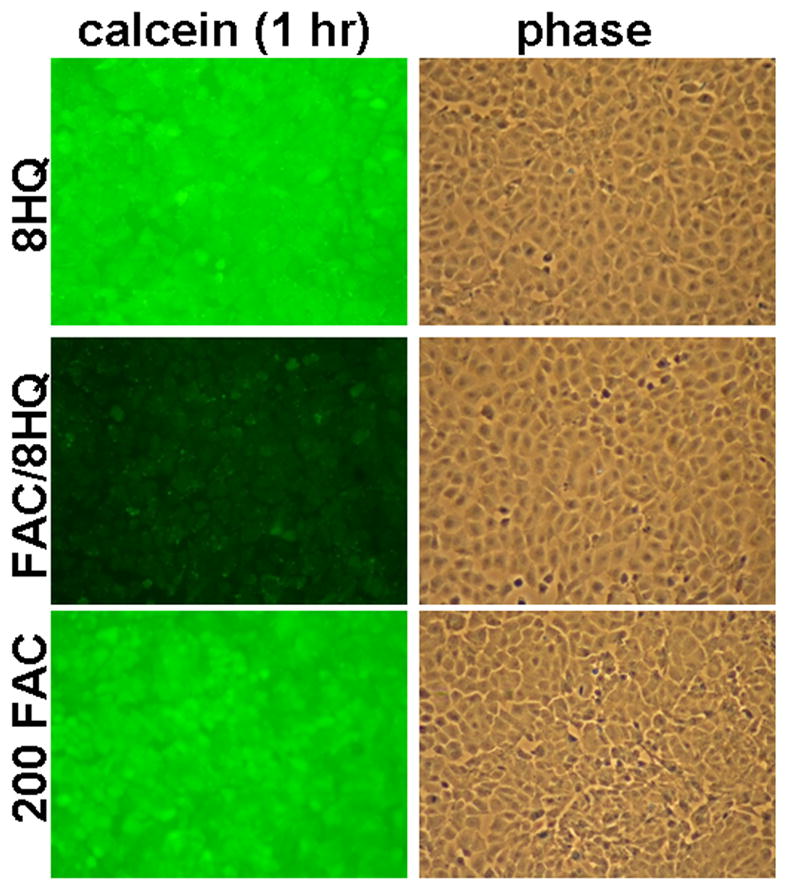
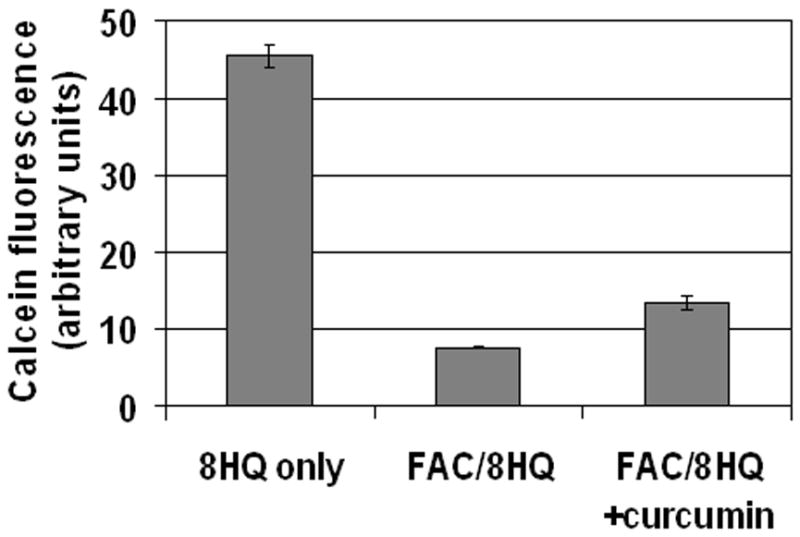
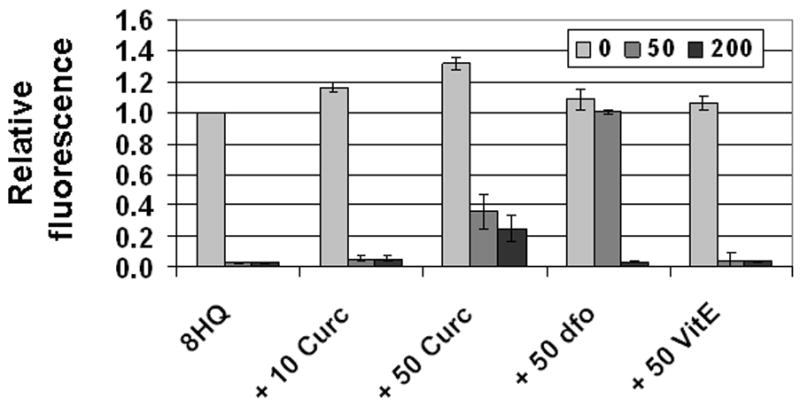
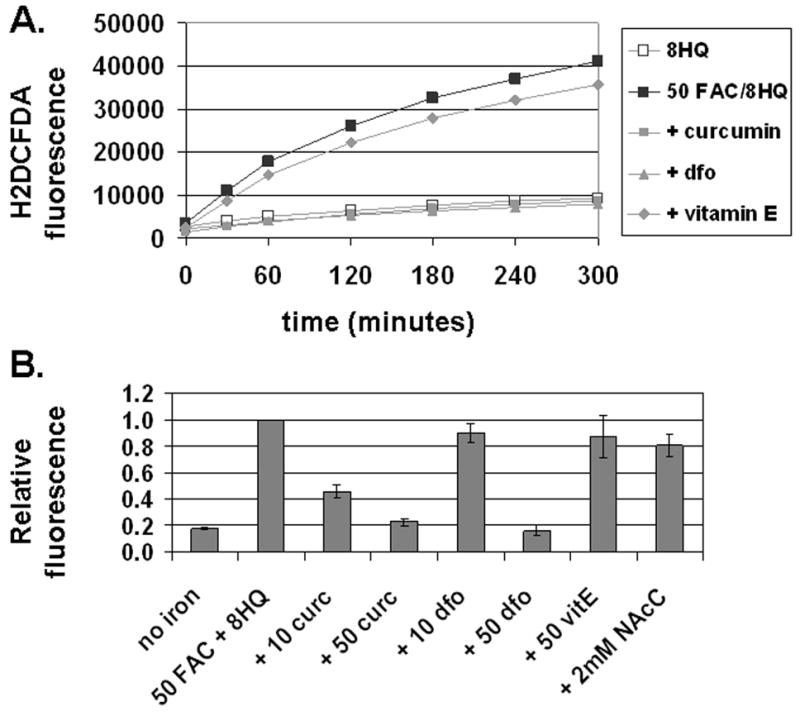
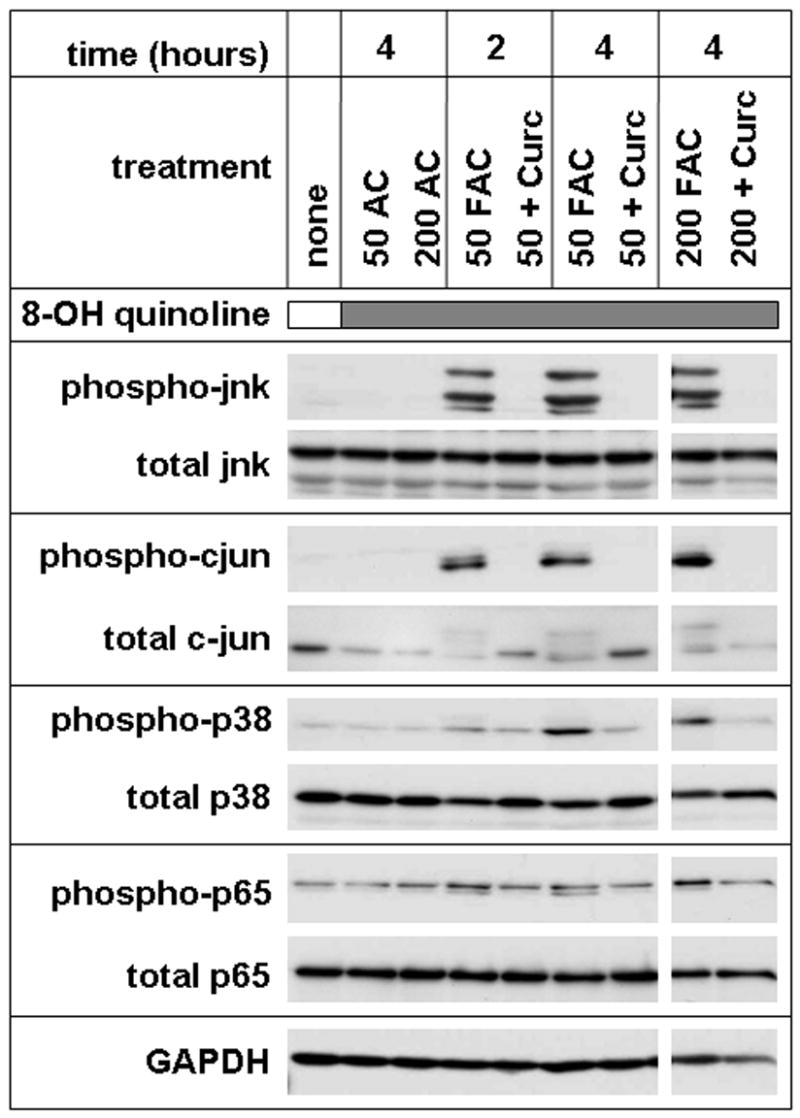
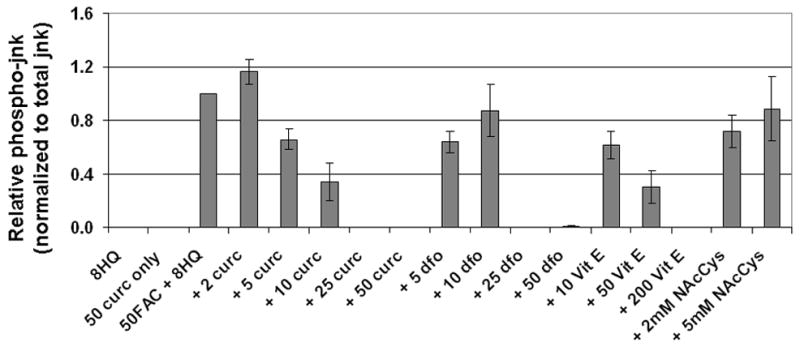
Methods: T51B cells were loaded with ferric ammonium citrate (FAC) with or without the iron delivery agent 8-hydroxyquinoline. Cytotoxicity was measured by methylthiazolyldiphenyl-tetrazolium bromide assay. Iron uptake and iron bioavailability were documented by chemical assay, quench of calcein fluorescence and ferritin induction. Reactive oxygen species (ROS) were measured by a fluorescence assay using 2',7'-dichlorodihydrofluorescein diacetate. Oxidative stress signalling to jnk, c-jun and p38 was measured by a Western blot with phospho-specific antibodies.

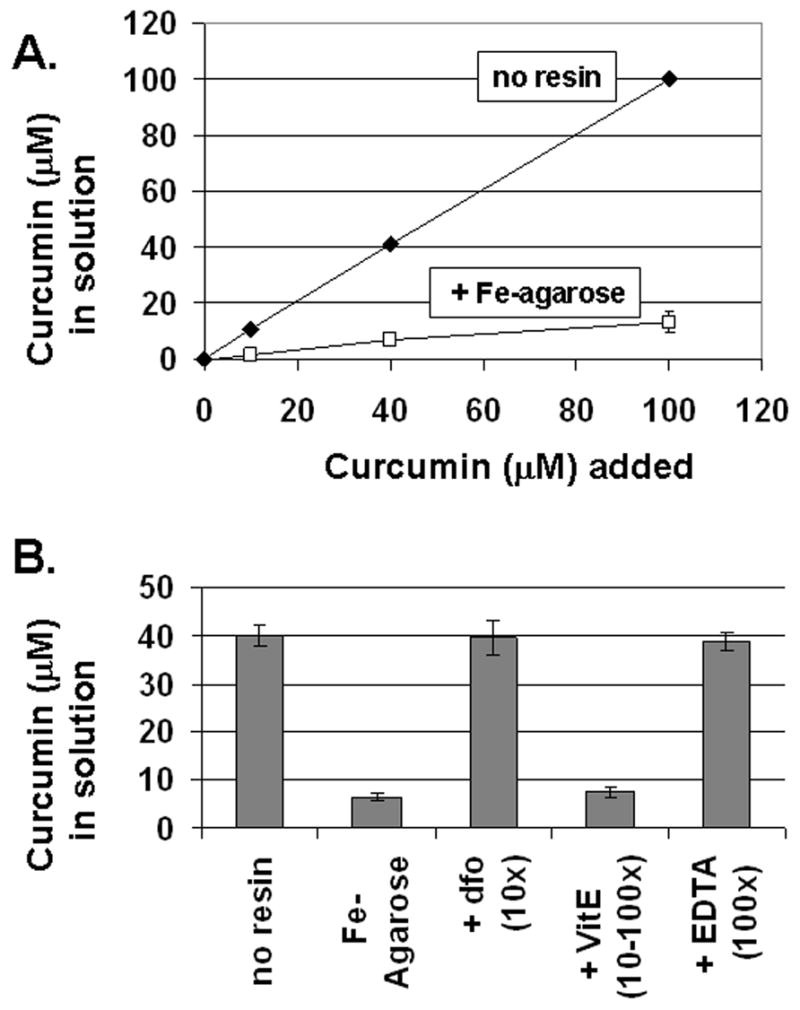
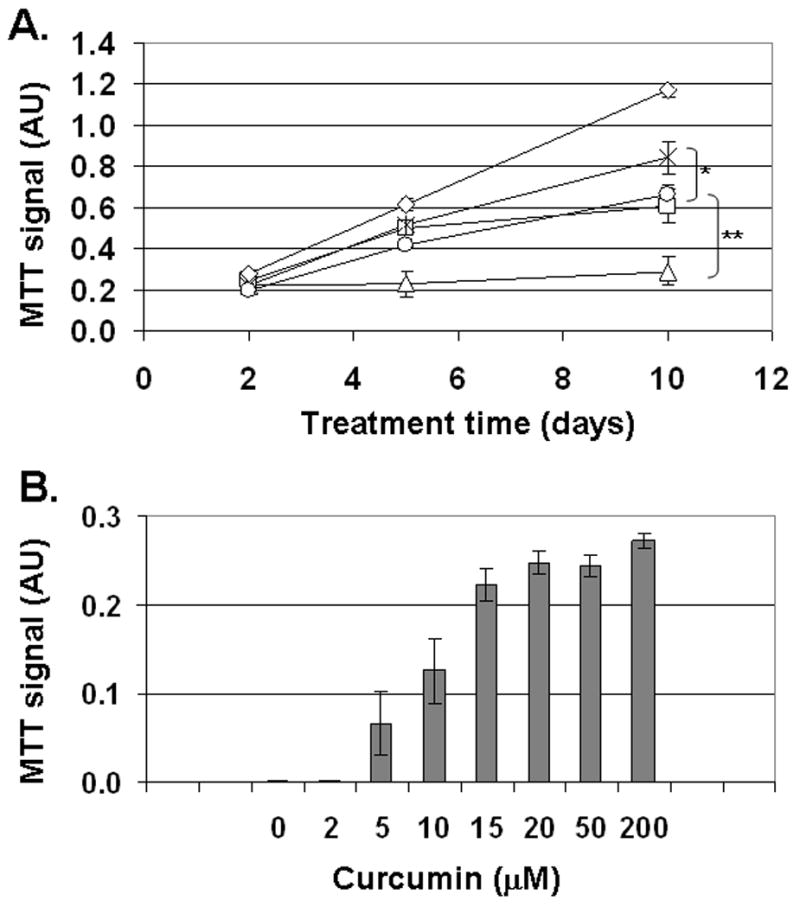
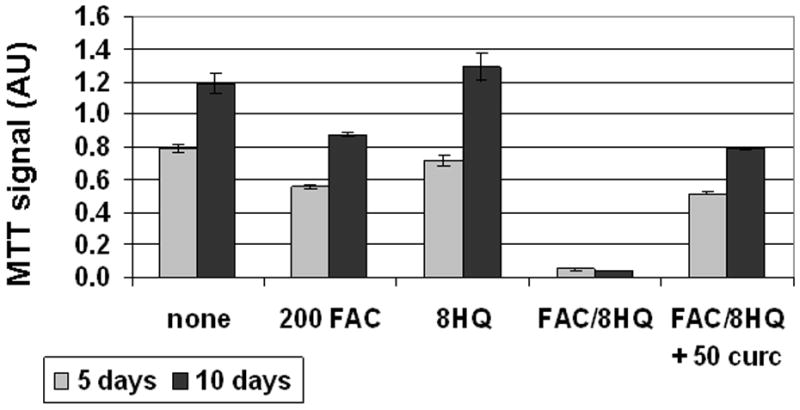
Results: Curcumin bound iron, but did not block iron uptake or bioavailability in T51B cells given FAC. However, it reduced cytotoxicity, blocked the generation of ROS and eliminated signalling to cellular stress pathways caused by iron. Inhibition was observed over a wide range of FAC concentrations (50-500 microM), with an apparent IC(50) in all cases between 5 and 10 microM curcumin. In contrast, desferoxamine blocked both iron uptake and toxic effects of iron at concentrations that depended on the FAC concentration. The effects of curcumin also differed from those of alpha-tocopherol, which did not bind iron and was less effective at blocking iron-stimulated ROS generation.

Conclusions: Curcumin reduced iron-dependent oxidative stress and iron toxicity in T51B cells without blocking iron uptake.


Figures

Figure 1
Figure 1
Curcumin binds to Iron. A. Removal of curcumin from solution by Fe-NTA resin. Increasing amounts of curcumin were incubated with Fe-NTA-Agarose (squares) or without (diamonds) as described under Materials and Methods. The unbound curcumin remaining in solution after removal of the resin was determined by absorbance at 435 nm. B. Inhibition of curcumin binding to iron. Curcumin (40 μM) was incubated alone (no resin), with iron resin (Fe- Agarose), or with iron resin preincubated with excess desferoxamine (dfo-10x), excess vitamin E (VitE 10-100x), or excess EDTA (100x). Unbound curcumin was determined as for panel A. The means +/− s.e. are presented from at least three independent determinations.
Figure 2
Figure 2
Curcumin reduces iron toxicity in T51B cells. A. Time course of cell growth in FAC. Cells treated with iron for 2, 5, or 10 days were assayed by MTT assay as described under Materials and Methods. The signals from untreated control cells (diamonds) are compared to 200 μM FAC (squares), 500 μM FAC (triangles), 200 μM FAC and 50 μM curcumin (stars), or 500 μM FAC and 50 μM curcumin (circles). Assays were performed in triplicate at the indicated times. The means +/− s.e. of data from 3 experiments are shown for each point. The significance of curcumin’s effects were calculated by two-tailed t-test at the 10 day time points (*p<0.05; **p<0.001). B. Concentration dependence of protection by curcumin. Cells were treated for 5 days with 500 μM FAC alone (500 FAC) or 500 μM FAC and curcumin (+ curc) at the indicated concentration (2–200 μM), and assayed in triplicate by MTT assay. The means +/− s.e. of data from 2–3 experiments are shown for each condition.
Figure 3
Figure 3
Curcumin does not block iron loading of T51B cells. A. Total iron content. Cells were untreated (none), or treated with 200 μM FAC (FAC), or 200 μM FAC with 50 μM curcumin (FAC + curc). Iron content was assayed colorimetrically as described under Materials and Methods. Mean values (nmol iron/mg cell protein) +/− s.d. of triplicates are reported. B. Quenching of intracellular calcein by iron. Cells were pulsed with calcein-AM and then incubated for 48 hours in media alone (top panels: no addition) or with addition of 200 μM FAC (middle panels: 200 FAC) or 200 μM FAC and 50 μM curcumin (bottom panels: FAC + curcumin). Identical fields viewed by FITC fluorescence (calcein) and phase contrast are shown for each. The cells were viewed without fixation. A decrease in green fluorescence indicates quenching of calcein by internalized iron. C. Ferritin induction by iron. Cells were left untreated (none) or treated with 200 μM FAC (200 FAC), 200 μM FAC and 50 μM curcumin (200 + curc), 500 μM FAC (500 FAC), or 500 μM FAC and 50 μM curcumin (500 + curc) for 5 days. Cell lysates were prepared and processed for western blot using antibodies specific for ferritin H or GAPDH as gel loading control. All results are representative of at least three independent experiments. Additional details are described under Materials and Methods.
Figure 4
Figure 4
The chelator 8-hydroxyquinoline accelerates iron loading. Cells were pulsed with calcein-AM, rinsed, and incubated at 37 °C for 1 hour in complete media containing: 10 μM 8-hydroxyquinoline only (top panels: 8HQ), 10 μM 8-hydroxyquinoline and 200 μM FAC (middle panels: FAC/8HQ), or 200 μM FAC only (bottom panels: 200 FAC). The cells were rinsed on ice and viewed within 1 hour without fixation. Identical fields for FITC fluorescence (calcein) and phase contrast are shown for each treatment. This experiment was repeated twice with similar results.
Figure 5
Figure 5
Curcumin reduces iron toxicity in the presence of 8-hydroxyquinoline. Cells were left untreated (none) or treated with 200 μM FAC (200 FAC), 10 μM 8-hydroxyquinoline (8HQ), 200 μM FAC and 10 μM 8-hydroxyquinoline and (FAC/8HQ), or 200 μM FAC and 10 μM 8-hydroxyquinoline and 50 μM curcumin (FAC/8HQ + 50 curc). They were assayed by MTT assay after 5 days (light bars) or 10 days (dark bars) as described under Materials and Methods. The mean +/− s of triplicate absorbance readings (540 nm) are presented. This experiment was repeated twice with similar results.
Figure 6
Figure 6
Curcumin does not block iron uptake mediated by 8-hydroxyquinoline. Cells were pulsed with calcein-AM, rinsed, and incubated at 37 °C for 2 hours in media containing 10 μM 8-hydroxyquinoline and: no iron (8HQ only), 200 μM FAC (FAC/8HQ), or 200 μM FAC and 50 μM curcumin (FAC/8HQ + curcumin). Control fields without calcein were used to define background for each condition. The calcein fluorescence from 6 distinct fields per condition was quantified as described under Materials and Methods, and mean values +/− s.e. are presented. This experiment was repeated twice with similar results.
Figure 7
Figure 7
Desferoxamine, but not curcumin, blocks iron uptake mediated by 8-hydroxyquinoline. Cells in 96 well plates were pulsed with calcein-AM, and then incubated at 37 °C for 2 hours in media containing either no iron (light bars), 50 μM FAC (medium bars), or 200 μM FAC (dark bars). Test wells contained 10 μM 8-hydroxyquinoline alone (8HQ), or 10 μM 8-hydroxyquinoline and either: 10 μM curcumin (+ 10 curc), 50 μM curcumin (+ 50 curc), 50 μM desferoxamine (+ 50 dfo), or 50 μM vitamin E (+ 50 VitE). Calcein fluorescence was quantified as described under Materials and Methods. Values (normalized to cells treated with calcein and 8-hydroxyquinoline only) are reported as means +/− se, using data from 3 independent experiments.
Figure 8
Figure 8
Curcumin and desferoxamine block iron-induced generation of reactive oxygen species (ROS). A. Time course of ROS generation. Cells loaded with oleic acid and H2DCFDA were treated at 37°C as specified. The fluorescent signal was measured at the indicated times as described under Materials and Methods. The treatment conditions were: 10 μM 8-hydroxyquinoline alone (open squares, 8HQ), 10 μM 8-hydroxyquinoline and 50 μM FAC without inhibitor (solid squares, 50FAC/8HQ), or 10 μM 8-hydroxyquinoline and 50 μM FAC with the inhibitors: 50 μM curcumin (+ curcumin), 50 μM desferoxamine (dfo), or 50 μM vitamin E (+ Vitamin E). Values for H2DCFDA-specific fluorescence are reported in arbitrary units as the means of triplicates. This representative experiment was repeated twice. B. Effect of potential inhibitors on ROS generation by iron. The change in H2DCFDA fluorescence from 1 to 3 hours was determined from a time course as for panel A. The treatment conditions were: 10 μM 8-hydroxyquinoline alone (no iron), 10 μM 8-hydroxyquinoline and 50 μM FAC without inhibitor (50FAC + 8HQ), or 10 μM 8-hydroxyquinoline and 50 μM FAC with the inhibitors: curcumin at 10 or 50 μM (+ 10 curc, + 50 curc), desferoxamine at 10 or 50 μM (+ 10 dfo, + 50 dfo), 50 μM vitamin E (+ 50 VitE), or 2 mM N-acetyl cysteine (+ 2mM NAcC). Signals from 2–4 independent experiments were normalized to the rate obtained without inhibitor and are expressed as means +/− s.e.
Figure 9
Figure 9
Curcumin blocks multiple iron-sensitive cell signaling pathways. Confluent cells were left untreated (none), or treated with 10 μM 8-hydroxyquinoline (shaded bar) and either 50 μM ammonium citrate (50 AC), 200 μM ammonium citrate (200 AC), 50 μM FAC (50 FAC), 50μM FAC and 50 μM curcumin (50 + curc), 200 μM FAC (200 FAC), or 200 μM FAC and 50 μM curcumin (200 + curc) for the indicated number of hours. Total cell lysates were analyzed by western blotting with antibodies to: jnk dually phosphorylated at thr183/tyr185 (phospho-jnk), c-jun phosphorylated at ser63 (phospho-cjun), p38 dually phosphorylated at thr180/tyr182 (phospho-p38), the p65 subunit of NF-kappaB phosphorylated at ser536 (phospho-p65), or glyceraldehyde 3-phosphate dehydrogenase (GAPDH) as loading control. Blots using antibodies that recognize each protein independently of phosphoylation state (total) are also shown. All panels are from a single gel. The results are representative of at least three similar experiments.
Figure 10
Figure 10
Curcumin is a potent inhibitor of jnk phospho-activation by iron. Cells treated for 2 hours were analyzed by western blot using antibodies specific for phospho-jnk and total jnk. The chemiluminescent signals were quantified as described under Materials and Methods. The relative p-jnk/total jnk ratios from 3–9 independent experiments (each normalized to the no inhibitor bands) are expressed as means +/− s.e. The treatments conditions were: 10 μM 8-hydroxyquinoline alone (8HQ), 10 μM 8-hydroxyquinoline and 50 μM curcumin (50 curc only), 10 μM 8-hydroxyquinoline and 50 μM FAC without inhibitor (50FAC + 8HQ), or 10 μM 8-hydroxyquinoline and 50 μM FAC with the inhibitors: curcumin at 2, 5, 10, 25 or 50 μM (+ 2 curc, + 5 curc, + 10 curc, + 25 curc, + 50 curc); desferoxamine at 5, 10, 25, or 50 μM (+ 5 dfo, + 10 dfo,+ 25 dfo, + 50 dfo); vitamin E at 10, 50, or 200 μM (+ 10 VitE, + 50 VitE,+ 200 VitE); or N-acetyl cysteine at 2 or 5 mM (+ 2mM NAcC, + 5mM NAcC).

Similar articles

Cited by

References

    1. Stal P. Iron as a hepatotoxin. Dig Dis. 1995;13(4):205–222. - PubMed
    1. Eaton JW, Qian M. Molecular bases of cellular iron toxicity. Free Radic Biol Med. 2002;32(9):833–840. - PubMed
    1. Haber F, Weiss J. The catalytic decompostion of hydrogen peroxide by iron salts. Proc Royal Society London Section A. 1934;147:332–351.
    1. Valko M, Morris H, Cronin MT. Metals, toxicity and oxidative stress. Curr Med Chem. 2005;12(10):1161–1208. - PubMed
    1. Klaunig JE, Kamendulis LM. The role of oxidative stress in carcinogenesis. Annu Rev Pharmacol Toxicol. 2004;44:239–267. - PubMed

Publication types

MeSH terms