

Population survey sampling methods in a rural African setting: measuring mortality
- PMID: 18492246
- PMCID: PMC2440730
- DOI: 10.1186/1478-7954-6-2
Population survey sampling methods in a rural African setting: measuring mortality
Abstract
Background: Population-based sample surveys and sentinel surveillance methods are commonly used as substitutes for more widespread health and demographic monitoring and intervention studies in resource-poor settings. Such methods have been criticised as only being worthwhile if the results can be extrapolated to the surrounding 100-fold population. With an emphasis on measuring mortality, this study explores the extent to which choice of sampling method affects the representativeness of 1% sample data in relation to various demographic and health parameters in a rural, developing-country setting.
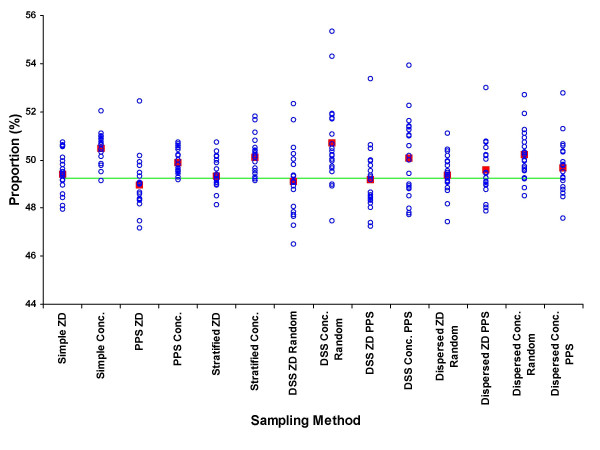
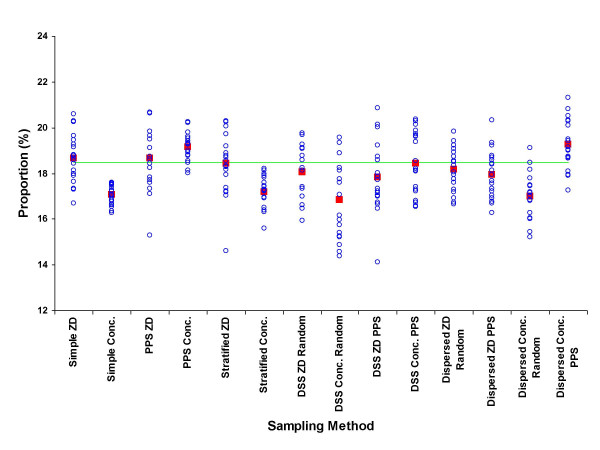
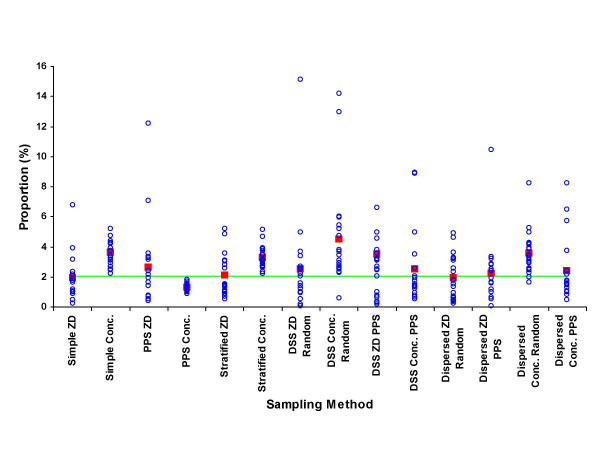
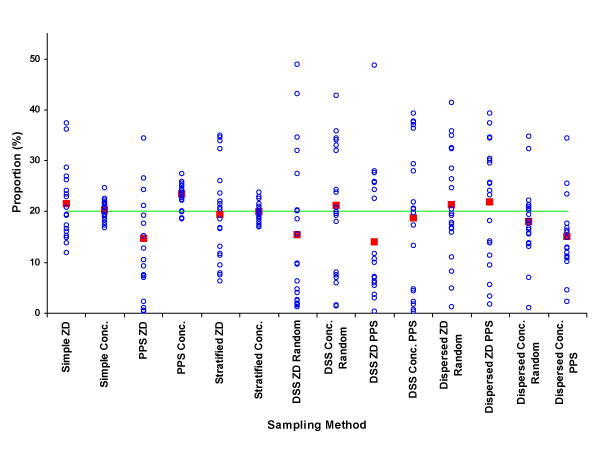
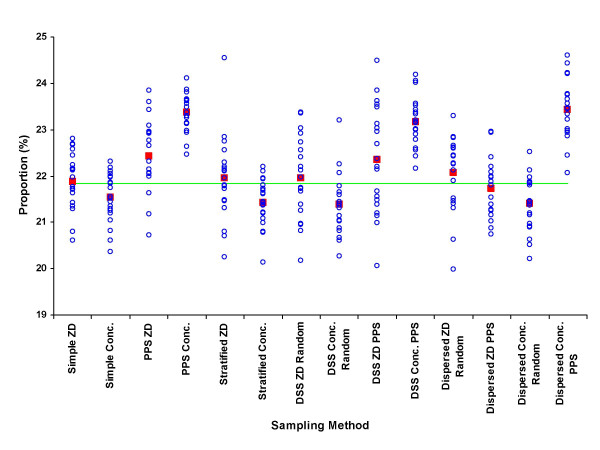
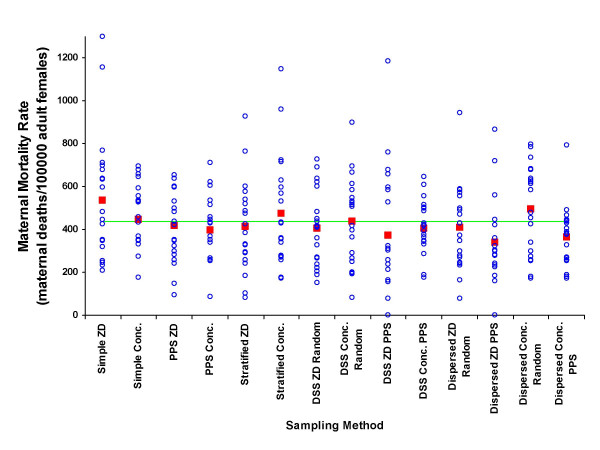
Methods: Data from a large community based census and health survey conducted in rural Burkina Faso were used as a basis for modelling. Twenty 1% samples incorporating a range of health and demographic parameters were drawn at random from the overall dataset for each of seven different sampling procedures at two different levels of local administrative units. Each sample was compared with the overall 'gold standard' survey results, thus enabling comparisons between the different sampling procedures.
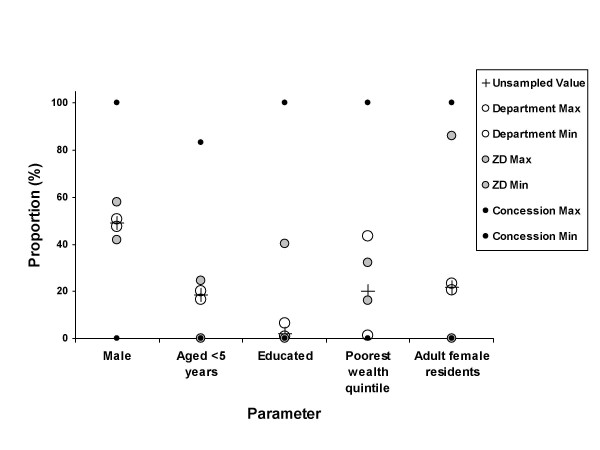
Results: All sampling methods and parameters tested performed reasonably well in representing the overall population. Nevertheless, a degree of variation could be observed both between sampling approaches and between different parameters, relating to their overall distribution in the total population.
Conclusion: Sample surveys are able to provide useful demographic and health profiles of local populations. However, various parameters being measured and their distribution within the sampling unit of interest may not all be best represented by a particular sampling method. It is likely therefore that compromises may have to be made in choosing a sampling strategy, with costs, logistics the intended use of the data being important considerations.
Figures
Similar articles
-
Empirical modelling of population sampling: lessons for designing sentinel surveillance.Public Health. 2003 Jan;117(1):36-42. doi: 10.1016/S0033-3506(02)00014-8. Public Health. 2003. PMID: 12802903
-
Measuring population health: costs of alternative survey approaches in the Nouna Health and Demographic Surveillance System in rural Burkina Faso.Glob Health Action. 2015 Aug 7;8:28330. doi: 10.3402/gha.v8.28330. eCollection 2015. Glob Health Action. 2015. PMID: 26257048 Free PMC article.
-
Studying dynamics of the HIV epidemic: population-based data compared with sentinel surveillance in Zambia.AIDS. 1998 Jul 9;12(10):1227-34. doi: 10.1097/00002030-199810000-00015. AIDS. 1998. PMID: 9677172
-
Demonstrating the robustness of population surveillance data: implications of error rates on demographic and mortality estimates.BMC Med Res Methodol. 2008 Mar 25;8:13. doi: 10.1186/1471-2288-8-13. BMC Med Res Methodol. 2008. PMID: 18366742 Free PMC article.
-
Applying research to AIDS programs in villages. Burkina Faso project learns from community survey.Sante Salud. 1994 Winter:7. Sante Salud. 1994. PMID: 12179556
Cited by
-
The INDEPTH Network: filling vital gaps in global epidemiology.Int J Epidemiol. 2012 Jun;41(3):579-88. doi: 10.1093/ije/dys081. Int J Epidemiol. 2012. PMID: 22798690 Free PMC article. No abstract available.
-
A two-stage cluster sampling method using gridded population data, a GIS, and Google Earth(TM) imagery in a population-based mortality survey in Iraq.Int J Health Geogr. 2012 Apr 27;11:12. doi: 10.1186/1476-072X-11-12. Int J Health Geogr. 2012. PMID: 22540266 Free PMC article.
-
Reliability of community health worker collected data for planning and policy in a peri-urban area of Kisumu, Kenya.J Community Health. 2012 Feb;37(1):48-53. doi: 10.1007/s10900-011-9414-2. J Community Health. 2012. PMID: 21769730 Free PMC article.
-
Dying to count: mortality surveillance in resource-poor settings.Glob Health Action. 2009 Mar 20;2. doi: 10.3402/gha.v2i0.1926. Glob Health Action. 2009. PMID: 20027269 Free PMC article.
-
Comparing two data collection methods to track vital events in maternal and child health via community health workers in rural Nepal.Popul Health Metr. 2022 Jul 27;20(1):16. doi: 10.1186/s12963-022-00293-4. Popul Health Metr. 2022. PMID: 35897038 Free PMC article.
References
-
- DHS Measure DHS http://www.measuredhs.com
LinkOut - more resources
Full Text Sources
