. 2008 May 20:7:41.
doi: 10.1186/1476-4598-7-41.

Anaplastic oligodendrogliomas with 1p19q codeletion have a proneural gene expression profile

Affiliations

Anaplastic oligodendrogliomas with 1p19q codeletion have a proneural gene expression profile

François Ducray et al. Mol Cancer. .

Abstract

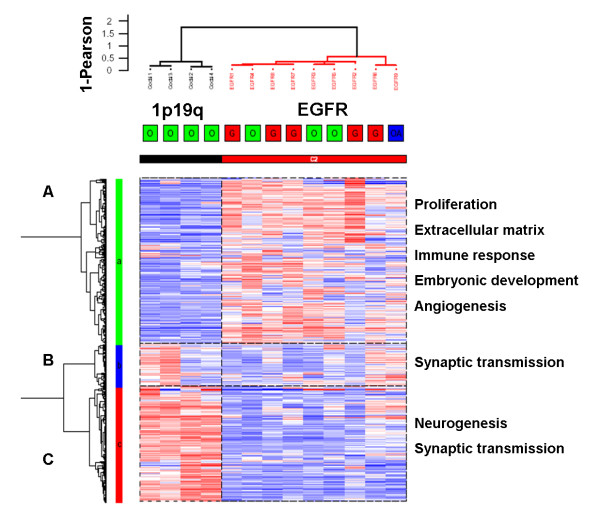
Background: In high grade gliomas, 1p19q codeletion and EGFR amplification are mutually exclusive and predictive of dramatically different outcomes. We performed a microarray gene expression study of four high grade gliomas with 1p19q codeletion and nine with EGFR amplification, identified by CGH-array.

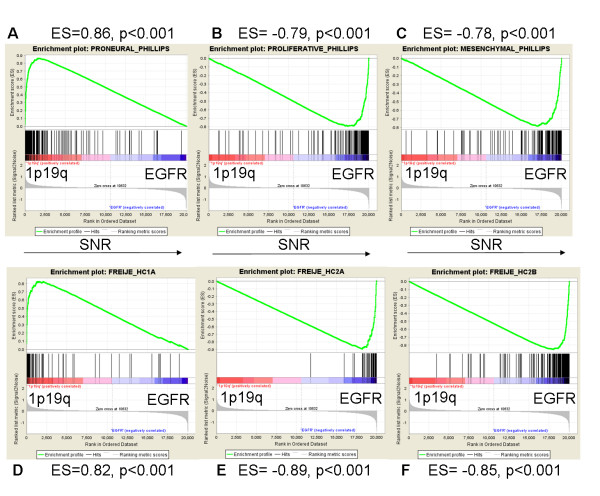
Results: The two groups of gliomas exhibited very different gene expression profiles and were consistently distinguished by unsupervised clustering analysis. One of the most striking differences was the expression of normal brain genes by oligodendrogliomas with 1p19q codeletion. These gliomas harbored a gene expression profile that partially resembled the gene expression of normal brain samples, whereas gliomas with EGFR amplification expressed many genes in common with glioblastoma cancer stem cells. The differences between the two types of gliomas and the expression of neuronal genes in gliomas with 1p19q codeletion were both validated in an independent series of 16 gliomas using real-time RT-PCR with a set of 22 genes differentiating the two groups of gliomas (AKR1C3, ATOH8, BMP2, C20orf42, CCNB1, CDK2, CHI3L1, CTTNBP2, DCX, EGFR, GALNT13, GBP1, IGFBP2, IQGAP1, L1CAM, NCAM1, NOG, OLIG2, PDPN, PLAT, POSTN, RNF135). Immunohistochemical study of the most differentially expressed neuronal gene, alpha-internexin, clearly differentiated the two groups of gliomas, with 1p19q codeletion gliomas showing specific staining in tumor cells.

Conclusion: These findings provide evidence for neuronal differentiation in oligodendrogliomas with 1p19q codeletion and support the hypothesis that the cell of origin for gliomas with 1p19q codeletion could be a bi-potential progenitor cell, able to give rise to both neurons and oligodendrocytes.


Figures

Figure 1
Figure 1
Genomic localization of the differentially expressed probe sets (p < 0.001) localized on chromosome 1, 19 and 10. Each probe set is represented by a dot. Probe sets are ordered along the x axis according to their genomic position (only probe sets with unambiguous genomic mapping on UCSC were used). For each chromosome, the telomere of the short arm is on the left, and the telomere of the long arm is on the right. The dashed vertical line represents the position of the centromere. The y axis corresponds to the log2 ratio of the geometric mean in the gliomas with complete 1p19q loss versus the gliomas with EGFR amplification. Almost all probe sets localized on 1p and 19q were underexpressed in gliomas with 1p19q codeletion, whereas most of the probe sets localized on chromosome 10 were overexpressed.
Figure 2
Figure 2
Unsupervised clustering of 4 oligodendrogliomas with 1p19q codeletion and 9 gliomas with EGFR amplification. Unsupervised hierarchical clustering was performed using the 1366 probe sets whose expression varied the most across the 13 samples (probe sets with a robust coefficient of variation superior to the 97.5th percentile). Samples and genes were clustered using Ward's linkage and 1-Pearson correlation coefficient. For each probe set, data were median-centered (white), with the lowest and highest intensity values in blue and red, respectively. 1p19q = 1p19q codeletion, EGFR = EGFR amplification. The gliomas were classified into 2 groups according to their genomic profile. Gliomas with EGFR amplification were classified into one cluster irrespective of their histology (red = glioblastoma, green = grade III oligodendroglioma, blue = grade III oligoastrocytoma). Gene cluster A was enriched in genes involved in proliferation, extracellular matrix, immune response, embryonic development and angiogenesis. Gene cluster B was enriched in genes involved in synaptic transmission. Gene cluster C was enriched in genes involved in neurogenesis and synaptic transmission.
Figure 3
Figure 3
Unsupervised clustering of 4 gliomas with 1p19q codeletion, 9 gliomas with EGFR amplification, 6 glioblastoma cancer stem cells cell lines and 10 normal brain tissue samples. Unsupervised hierarchical clustering was performed using the 1366 probe sets whose expression varied the most across the 29 samples (probe sets with a robust coefficient of variation superior to the 97.5th percentile). Samples and genes were clustered using Ward's linkage and 1-Pearson correlation coefficient. For each probe set, data were median-centered (white), with the lowest and highest intensity values in blue and red, respectively. 1p19q = 1p19q codeletion, EGFR = EGFR amplification, CC = corpus callosum, Cx = cortex, CSC = cancer stem cells. The 29 gliomas were classified into 2 groups and 5 subgroups. Gliomas with EGFR amplification were classified with the cancer stem cell lines. Gliomas with 1p19q codeletion were classified with the normal brain samples, however their gene expression pattern was clearly different from the gene expression pattern of the white matter (corpus callosum) and grey matter (cortex) samples.
Figure 4
Figure 4
GSEA Enrichment Score curves. Gene set enrichment analysis (GSEA) was performed with 6 different gene sets obtained from the studies of Phillips et al. and Freije et al. Phillips' study gene sets: A: Proneural gene set (n = 220 genes), B: Proliferative gene set (n = 148 genes), C: Mesenchymal gene set (n = 126 genes). Freije's study gene sets: D: HC1A neurogenesis related gene set (n = 73), E: HC2A proliferation related gene set (n = 66 genes), F: HC2B extracellular matrix related gene set (n = 239 genes) [5, 28]. "Signal-to-Noise" ratio (SNR) statistic was used to rank the genes according to their correlation with either the 1p19q codeletion phenotype (red) or EGFR amplification phenotype (blue). The graph on the bottom of each panel represents the ranked, ordered, non-redundant list of genes. Genes on the far left (red) correlated the most with 1p19q codeleted samples, and genes on the far right (blue) correlated the most with EGFR amplified samples. On each panel, the vertical black lines indicate the position of each of the genes of the studied gene set in the ordered, non-redundant data set. The green curve corresponds to the ES (enrichment score) curve, which is the running sum of the weighted enrichment score obtained from GSEA software. A and D show that gliomas with 1p19q codeletion were significantly enriched in the proneural and neurogenesis related (HC1A) gene sets. B, C, D and E show that gliomas with EGFR amplification were significantly enriched in the proliferation/HC2A and mesenchymal/HC2B gene sets.
Figure 5
Figure 5
Unsupervised clustering of the 4 gliomas with 1p19q codeletion and the 9 gliomas with EGFR amplification using 35 genes signature of Phillips et al. [5]. Samples and genes were clustered using Ward's linkage and 1-Pearson correlation coefficient. 1p19q = gliomas with 1p19q codeletion, EGFR = gliomas with EGFR amplification. Gliomas with 1p19q codeletion were classified as proneural, whereas gliomas with EGFR amplification had both a mesenchymal and proliferative profile. In red are the genes whose expression was studied in real-time RT-PCR in an independent data set.
Figure 6
Figure 6
Real-time RT PCR study of 22 genes differentially expressed between 1p19q codeleted gliomas and EGFR amplified gliomas. Real-time RT-PCR study of 11 genes overexpressed in gliomas with EGFR amplification (top) and 11 genes overexpressed in gliomas with 1p19q codeletion (bottom) was performed in an independent data set of 16 gliomas (8 gliomas with EGFR amplification (triangles), 8 gliomas with 1p19q codeletion (circles)). Each dot represents the relative expression (log2 transformed) of a given gene in one glioma compared with normal brain (median expression in the 3 normal brain samples). Dots above the upper dashed line are upregulated with a fold change larger than 2 in comparison to normal brain; dots below the lower dashed line are downregulated in comparison to normal brain with a fold change larger than 2. For example, NOG, BMP2 and ATOH8 were overexpressed in all 8 gliomas with 1p19q codeletion (circles) in comparison to all 8 gliomas with EGFR amplification (triangles) and in comparison to normal brain. CHI3L1, PLAT, IQGAP1, IGFFBP2 and GBP1were overexpressed in all gliomas with EGFR amplification (triangles) in comparison to gliomas with 1p19q codeletion (circles) and in comparison to normal brain. Except for NCAM1, all 22 genes were differentially expressed (p < 0.05).
Figure 7
Figure 7
INA immunohistochemistry in 1p19q codeleted and EGFR amplified gliomas. Representative alpha-internexin (INA) immunohistostaining in oligodendrogliomas with 1p19q codeletion (A, C, D) and in glioblastomas with EGFR amplification (B). C: the arrow shows immunopositivity in an entrapped neuron surrounded by immunopositive tumor cells.

References

    1. Idbaih A, Marie Y, Pierron G, Brennetot C, Hoang-Xuan K, Kujas M, Mokhtari K, Sanson M, Lejeune J, Aurias A, Delattre O, Delattre JY. Two types of chromosome 1p losses with opposite significance in gliomas. Ann Neurol. 2005;58:483–487. doi: 10.1002/ana.20607. - DOI - PubMed
    1. Jenkins RB, Blair H, Ballman KV, Giannini C, Arusell RM, Law M, Flynn H, Passe S, Felten S, Brown PD, Shaw EG, Buckner JC. A t(1;19)(q10;p10) mediates the combined deletions of 1p and 19q and predicts a better prognosis of patients with oligodendroglioma. Cancer Res. 2006;66:9852–9861. doi: 10.1158/0008-5472.CAN-06-1796. - DOI - PubMed
    1. Idbaih A, Marie Y, Lucchesi C, Pierron G, Manie E, Raynal V, Mosseri V, Hoang-Xuan K, Kujas M, Brito I, Mokhtari K, Sanson M, Barillot E, Aurias A, Delattre JY, Delattre O. BAC array CGH distinguishes mutually exclusive alterations that define clinicogenetic subtypes of gliomas. Int J Cancer. 2008;122:1778–1786. doi: 10.1002/ijc.23270. - DOI - PubMed
    1. Dehais C, Laigle-Donadey F, Marie Y, Kujas M, Lejeune J, Benouaich-Amiel A, Pedretti M, Polivka M, Xuan KH, Thillet J, Delattre JY, Sanson M. Prognostic stratification of patients with anaplastic gliomas according to genetic profile. Cancer. 2006;107:1891–1897. doi: 10.1002/cncr.22211. - DOI - PubMed
    1. Phillips HS, Kharbanda S, Chen R, Forrest WF, Soriano RH, Wu TD, Misra A, Nigro JM, Colman H, Soroceanu L, Williams PM, Modrusan Z, Feuerstein BG, Aldape K. Molecular subclasses of high-grade glioma predict prognosis, delineate a pattern of disease progression, and resemble stages in neurogenesis. Cancer Cell. 2006;9:157–173. doi: 10.1016/j.ccr.2006.02.019. - DOI - PubMed

MeSH terms