

The relationship between fasting hyperglycemia and insulin secretion in subjects with normal or impaired glucose tolerance
- PMID: 18492770
- PMCID: PMC4043181
- DOI: 10.1152/ajpendo.00674.2007
The relationship between fasting hyperglycemia and insulin secretion in subjects with normal or impaired glucose tolerance
Abstract
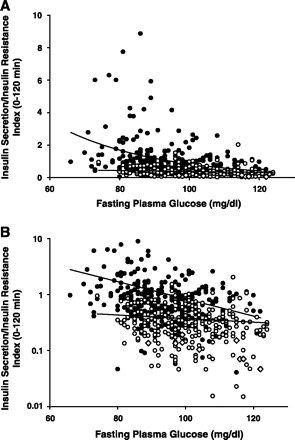
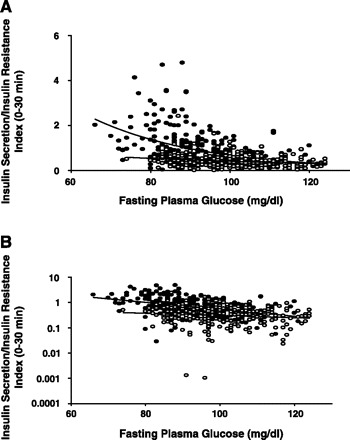
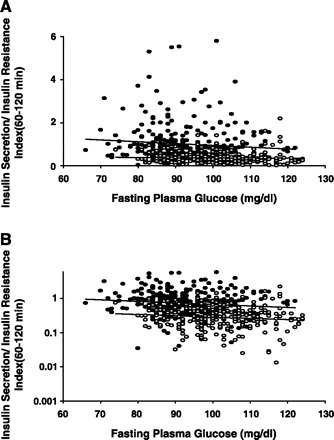
To assess the relationship between the fasting plasma glucose (FPG) concentration and insulin secretion in normal glucose tolerance (NGT) and impaired glucose tolerance (IGT) subjects, 531 nondiabetic subjects with NGT (n = 293) and IGT (n = 238; 310 Japanese and 232 Mexican Americans) received an oral glucose tolerance test (OGTT) with measurement of plasma glucose, insulin, and C-peptide every 30 min. The insulin secretion rate was determined by plasma C-peptide deconvolution. Insulin sensitivity (Matsuda index) was measured from plasma insulin and glucose concentrations. The insulin secretion/insulin resistance (IS/IR) or disposition index was calculated as DeltaISR/DeltaG / IR. As FPG increased in NGT subjects, the IS/IR index declined exponentially over the range of FPG from 70 to 125 mg/dl. The relationship between the IS/IR index and FPG was best fit with the equation: 28.8 exp(-0.036 FPG). For every 28 mg/dl increase in FPG, the IS/IR index declined by 63%. A similar relationship between IS/IR index and FPG was observed in IGT. However, the decay constant was lower than in NGT. The IS/IR index for early-phase insulin secretion (0-30 min) was correlated with the increase in FPG in both NGT and IGT (r = -0.43, P < 0.0001 and r = -0.20, P = 0.001, respectively). However, the correlation between late-phase insulin secretion (60-120 min) and FPG was not significant. In conclusion, small increments in FPG, within the "normal" range, are associated with a marked decline in glucose-stimulated insulin secretion and the decrease in insulin secretion with increasing FPG is greater in subjects with NGT than IGT and primarily is due to a decline in early-phase insulin secretion.
Figures
References
-
- DeFronzo RA. Lilly lecture 1987 RA. The triumvirate: beta-cell, muscle, liver.A collusion responsible for NIDDM. Diabetes 37: 667–687, 1988 - PubMed
-
- DeFronzo RA. Pathogenesis of type 2 diabetes mellitus. Med Clin North Am 8: 787–835, 2004 - PubMed
-
- Bergman RN, Finegood DT, Kahn SE. The evolution of beta-cell dysfunction and insulin resistance in type 2 diabetes. Eur J Clin Invest 32: 35–45, 2002 - PubMed
-
- Kahn SE. The relative contributions of insulin resistance and beta-cell dysfunction to the pathophysiology of type 2 diabetes. Diabetologia 46: 3–19, 2003 - PubMed
-
- Kahn SE. Clinical review 135: The importance of beta-cell failure in the development and progression of type 2 diabetes. J Clin Endocrinol Metab 86: 4047–4058, 2001 - PubMed
MeSH terms
Substances
Grants and funding
LinkOut - more resources
Full Text Sources
Medical
Research Materials