. 2008 Aug 15;17(16):2552-69.
doi: 10.1093/hmg/ddn156. Epub 2008 May 20.

Reduced SMN protein impairs maturation of the neuromuscular junctions in mouse models of spinal muscular atrophy

Affiliations

Reduced SMN protein impairs maturation of the neuromuscular junctions in mouse models of spinal muscular atrophy

Shingo Kariya et al. Hum Mol Genet. .

Abstract

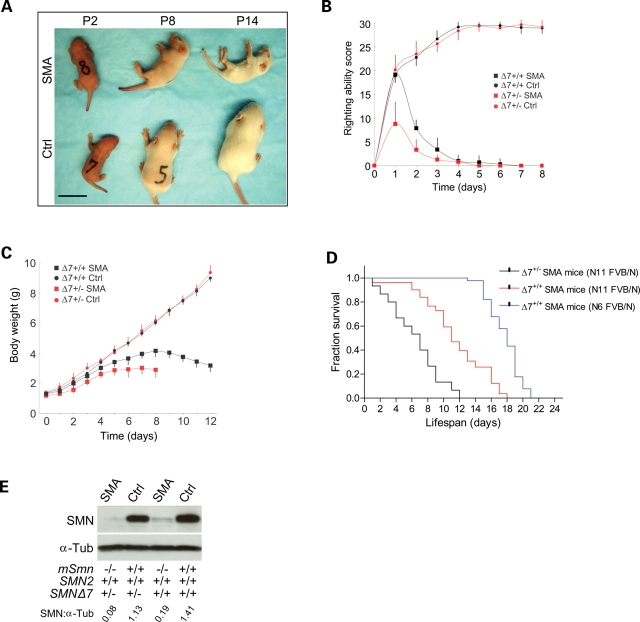
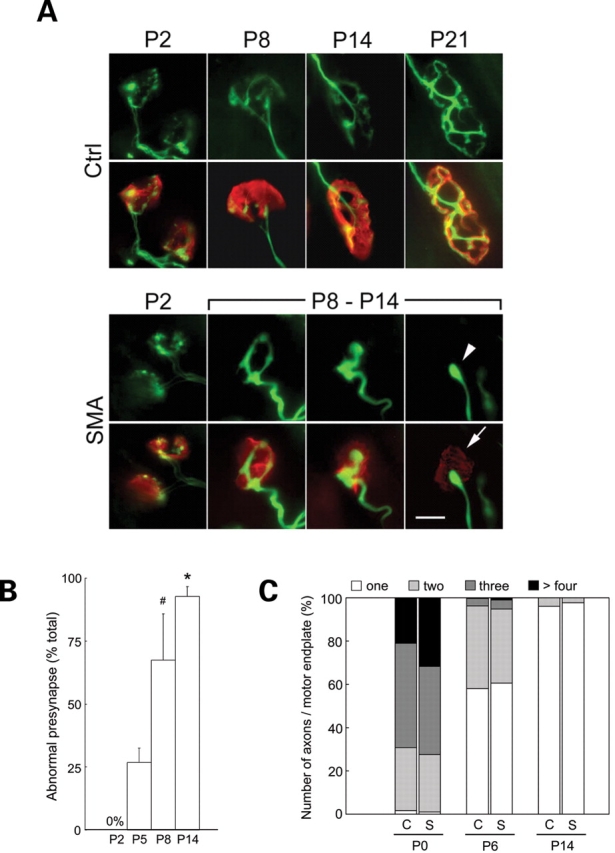
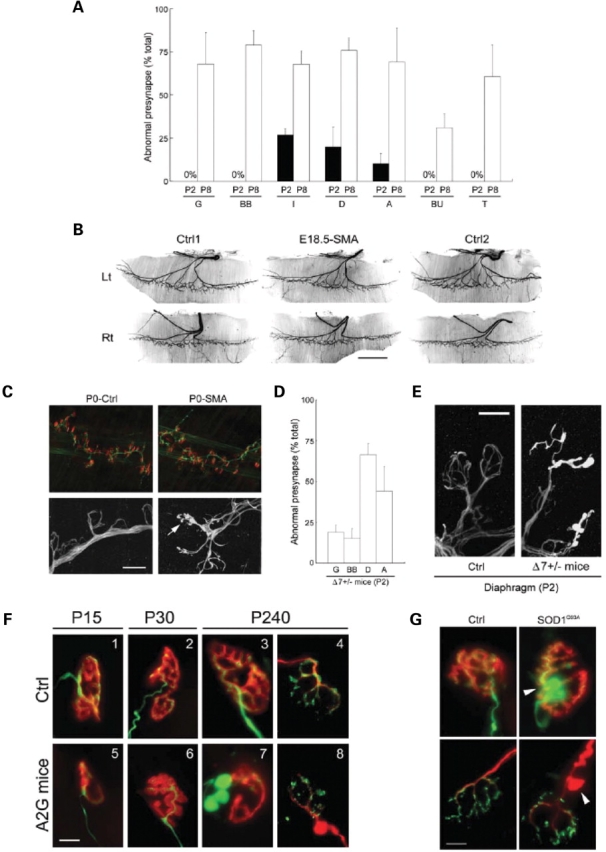
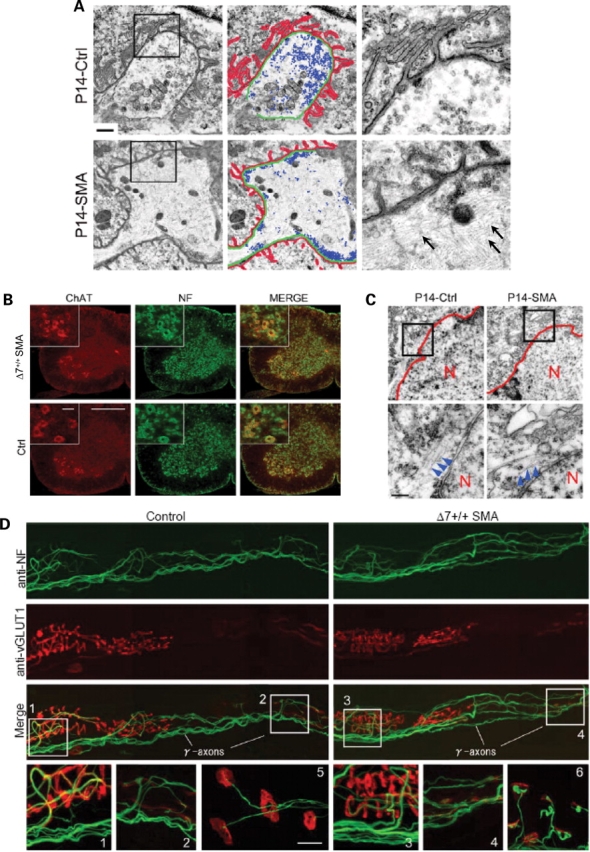
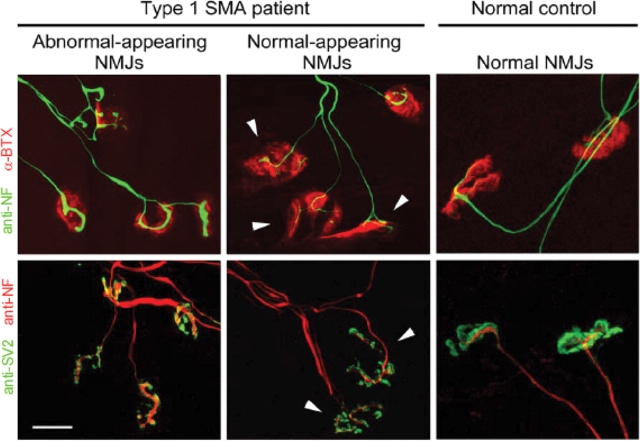
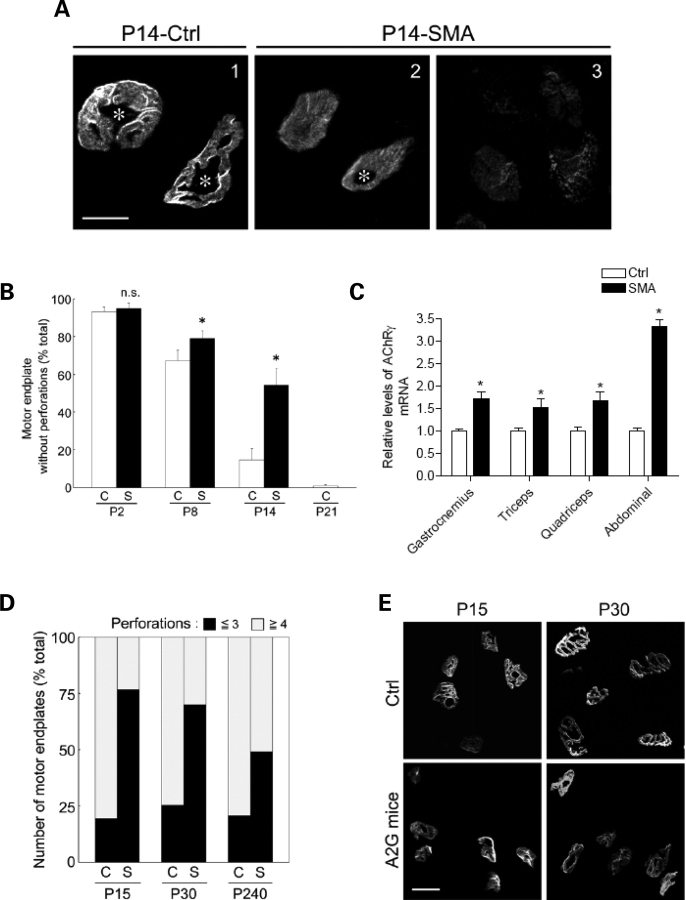
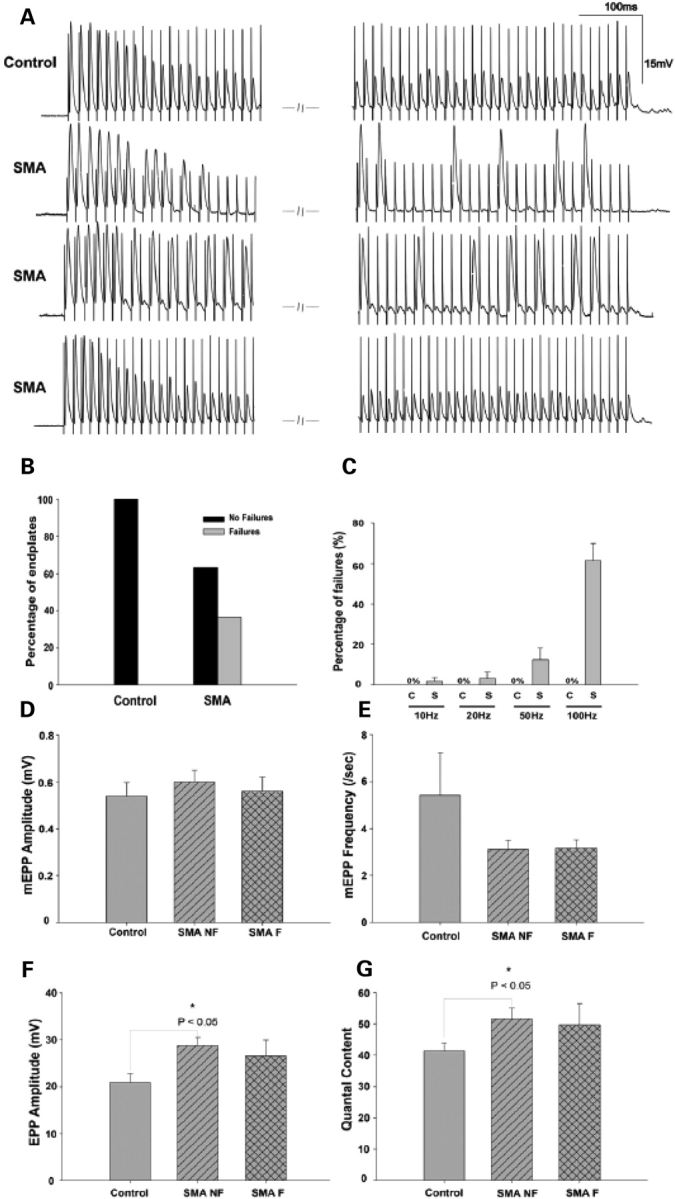
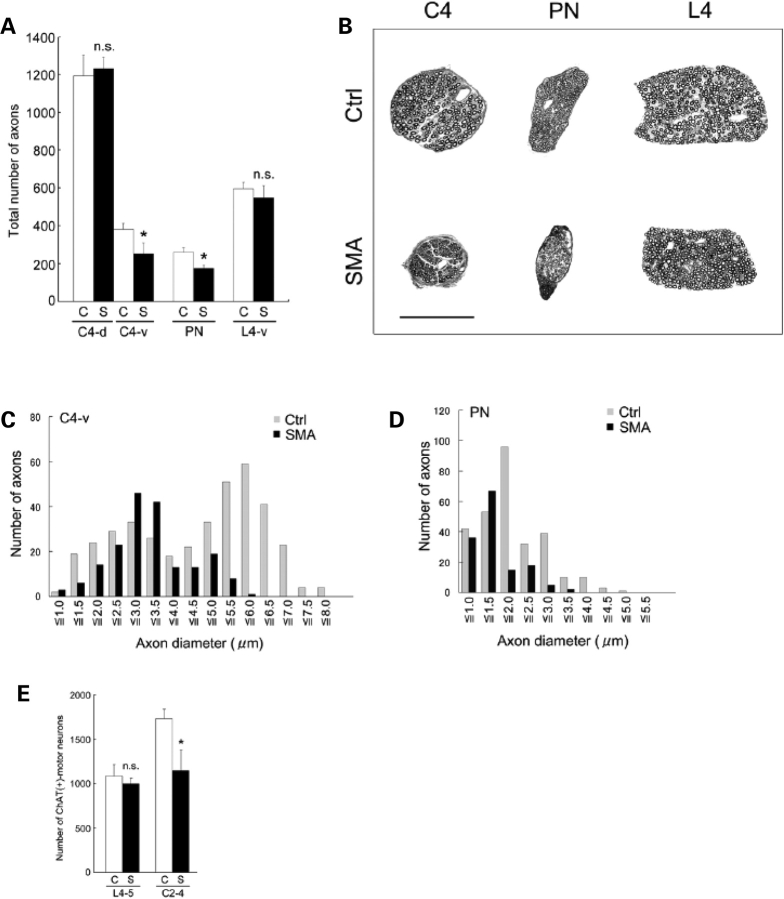
Spinal muscular atrophy (SMA) is a common pediatric neuromuscular disorder caused by insufficient levels of the survival of motor neuron (SMN) protein. Studies involving SMA patients and animal models expressing the human SMN2 gene have yielded relatively little information about the earliest cellular consequences of reduced SMN protein. In this study, we have used severe- and mild-SMN2 expressing mouse models of SMA as well as material from human patients to understand the initial stages of neurodegeneration in the human disease. We show that the earliest structural defects appear distally and involve the neuromuscular synapse. Insufficient SMN protein arrests the post-natal development of the neuromuscular junction (NMJ), impairing the maturation of acetylcholine receptor (AChR) clusters into 'pretzels'. Pre-synaptic defects include poor terminal arborization and intermediate filament aggregates which may serve as a useful biomarker of the disease. These defects are reflected in functional deficits at the NMJ characterized by intermittent neurotransmission failures. We suggest that SMA might best be described as a NMJ synaptopathy and that one promising means of treating it could involve maintaining function at the NMJ.


Figures

Figure 1.
Figure 1.
Phenotypic characteristics of SMA mice. (A) Phenotypes of fully congenic FVB/N Δ7+/+ SMA mice and Control (Ctrl) littermates during the course of the disease. Scale bar: 2 cm. (B) Righting ability curves of SMA mice: SMN2+/+;SMNΔ7+/+;Smn−/− (black squares); SMN2+/+;SMNΔ7+/−;Smn−/− (red squares) and Ctrl: SMN2+/+;SMNΔ7+/+;Smn+/+ (black circles), SMN2+/+;SMNΔ7+/−;Smn+/+ (red circles). Scores were assigned as described in methods; n= 10 in each case. (C) Body weight graphs of SMA mice and Control littermates between birth and P12; n = 10 in each case. (D) Kaplan–Meier survival curves of SMA mice. The log-rank test indicated a significant difference (P < 0.0001) between mean survival of the fully congenic (N11 FVB/N) Δ7+/+ and partially congenic SMA mice of the same genotype. Δ7+/+ mice also live significantly longer than Δ7+/− SMA mice. Note: n = 15, 81 and 90 for the Δ7+/−, N11 FVB/N Δ7+/+ and N6 FVB/N Δ7+/+ SMA mice, respectively; survival expressed as mean ± SEM. (E) Western blots of SMN in the lumbar (L1–L5) spinal cords of P2 SMA mice and Ctrl.
Figure 2.
Figure 2.
Pre-synaptic NMJ defects in severe-SMA mice. (A) Representative images of NMJs in the gastrocnemius muscle of Δ7+/+ SMA mice and a Control littermate highlighting defects in the mutant as the disease progresses. Green: pre-synapse (NF and SV2 staining). Red: motor endplates (rhodamine-α-BTX staining). Arrowhead: a severely shrunken (bulb-like) nerve terminal apposed to an endplate characterized by weakly staining AChR clusters (arrow). Scale bar: 10 µm. (B) Quantification of defective terminals in the gastrocnemius of Δ7+/+ SMA mice indicating increasing numbers of abnormal NMJs with age. Increases in defective terminals are statistically significant. ‘Asterisk' denotes P < 0.01 (versus P8, t-test); ‘Hash' indicates P < 0.01 (versus P5, t-test); n = 3. (C) The proportion of axons per motor endplate in the gastrocnemius muscles of Δ7+/+ SMA mice (S) and Ctrl (C) indicates normal timing of synapse elimination in affected mice.
Figure 3.
Figure 3.
Onset of pre-synaptic NMJ defects in SMA mice. (A) Pre-synaptic defects in representative proximal and distal muscles of Δ7+/+ SMA mice depicting the relatively early (P2) appearance of defects in proximal muscle groups. G, gastrocnemius; BB, biceps brachii; I, internal intercostals; D, diaphragm; A, oblique abdominal; BU, buccinator, and T, tongue muscles. Data represented as mean ± SD (n = 3). (B) Hemi-diaphragms of E18.5 Δ7+/+ SMA and Control (Ctrl1,2) littermates stained with an antibody against NF protein depicting normal branching and innervation by branches of the phrenic nerve in mutants. Scale bar: 1 mm. (C) At birth (P0) NMJs in the diaphragms of Δ7+/+ SMA mice exhibit clear signs of pre-synaptic NF aggregates (arrow). Upper panels: green (NF staining), red (rhodamine-α-BTX staining). Lower panels: NF staining. Scale bar: 10 µm for lower panels, 56 µm for upper panels. (D) Onset of pre-synaptic defects is a correlate of SMN levels and appears in all muscles sampled in Δ7+/− SMA mice as early as P2. (E) Poor terminal arborization and aggregates of NF protein in the pre-synapse of NMJs in Δ7+/− SMA diaphragms. Scale bar: 10 µm. (F) NMJs in the gastrocnemius muscles of mild-SMA mice and Control (Ctrl) littermates depicting increasingly obvious defects as the disease progresses. (1–3, 5–7): green (NF and SV2 staining), red (rhodamine-α-BTX staining). (4, 8): green (SV2 staining), red (NF staining). Scale bar: 10 µm. (G) NF accumulation in pre-terminal axons in the gastrocnemius muscle of end-stage SOD1G93A mice (P166). Upper panels: green (NF and SV2 staining), red (rhodamine-α-BTX staining). Lower panels: green (SV2 staining), red (NF staining). Ctrl: age-matched non-transgenic mouse. Arrow heads: axonal swellings filled with NF. Scale bar: 10 µm.
Figure 4.
Figure 4.
NF accumulation at the distal ends of SMA α-motor axons. (A) Electron micrographs of NMJs in the diaphragms of a P14 Δ7+/+ SMA mouse and Control (Ctrl) littermate depicting profound abnormalities of the pre- (swollen terminal filled with intermediate filaments, abnormal distribution of synaptic vesicles) as well as post-synapse (shallow junctional folds) in the mutant. Post-synaptic folds, terminal axons and synaptic vesicles are indicated in red, green and blue, respectively. High magnification images of insets are shown on the right with NF indicated by arrows. Scale bar: 1 µm. (B) Perikarya of C4 level spinal motor neurons from a P14 Δ7+/+ SMA mouse do not indicate abnormal accumulations of NF protein. Scale bar: 360 µm, inset: 10 µm. (C) Electron micrographs of the motor neurons confirmed the immunohistochemical results. Low levels of cytoplasmic NF found in Control and SMA motor neurons are indicated by the arrowheads; N, motor neuron nucleus. Scale bar: 300 nm. (D) Muscle spindles in the pronator teres muscle from a P14 Δ7+/+ SMA mouse indicating the apparent resistance of γ-motor axons to reduced SMN protein. Post-synapses were detected with rhodamine-α-BTX (red). Anulospiral endings of sensory axons around intrafusal fibers (1, 3) were detected using an anti-vesicular glutamate transporter 1 (red). NMJs of α-motor axons are indicated in 5 and 6. NMJs of γ-motor axons in the same muscle are indicated in 2 and 4. NF aggregates were found at α-motor nerve terminals but not in sensory axons or γ-motor terminals. Scale bar: 10 µm for the bottom panels (1–6).
Figure 5.
Figure 5.
NMJ defects in SMA patients. NMJ defects similar to those found in SMA mice are apparent in human SMA patients. Approximately 70% of NMJs in the diaphragms of 6 months old type I SMA patients exhibit pre-synaptic defects characterized by NF accumulation and poor terminal arborization. Endplates are poorly structured and stain weakly for labeled-BTX. A few NMJs appear morphologically normal (arrow heads). Normal NMJs in the diaphragm of an age-matched Control (right-side panels). Scale bar: 20 µm.
Figure 6.
Figure 6.
Post-synaptic NMJ defects in SMA mice. (A) Motor endplates in gastrocnemius muscles of a P14 Δ7+/+ SMA mouse and a Control (Ctrl) littermate indicate that the NMJs of affected animals appear immature (few perforations, weak staining, lack of synaptic folds). In some cases, disassembled AChRs were noted (3). NMJ perforations are indicated with asterisks. Scale bar: 10 µm. (B) Quantification of plaque-like (structurally immature motor endplates without perforations) AChR clusters in the gastrocnemius muscles of Δ7+/+ SMA mice (S) and Ctrl (C); n = 3. ‘Asterisk' denotes P < 0.01 (versus Control, Student's t-test). n.s.: not significant. (C) An increase in transcript levels of the embryonic (γ) subunit of the AChR in SMA mice. ‘Asterisk' denotes P < 0.01 (Student's t-test). (D) Motor endplates with less than three perforations in the gastrocnemius muscles of mild (A2G) SMA mice (S) and Ctrl (C) at different ages indicate early (P15) evidence of post-synaptic defects. (E) Representative images of motor endplates used to quantify post-synaptic defects in (D). Scale bar: 3.85 µm.
Figure 7.
Figure 7.
Functional characterization of NMJs in mild-SMA mice. (A) Trains of end-plate potentials (EPPs) at 100 Hz stimulation recorded from mutant and wild-type NMJs. Wild-type junctions displayed moderate depression but had no transmission failures (top trace). A proportion of mutant junctions responded similarly (bottom trace) while the rest (36.7%) exhibited intermittent transmission failures (second and third trace). (B) Graphical representation of mutant and wild-type junctions exhibiting failures (mutant NMJs, n = 30; wild-type NMJs, n = 25). (C) The failure rate (mean for all junctions) increased with stimulus frequency in the SMA mutant junctions; (10 Hz; 1.82 ± 1.82%, 20 Hz; 3.33 ± 2.88%, 50 Hz; 12.59 ± 5.70%, 100 Hz; 61.55±8.29%) while wild-type NMJs did not fail at any frequency tested. (C, wild-type; S, SMA). (D–G) Neurotransmission parameters in mutant (non-failing: SMA NF; failing: SMA F) and wild-type NMJs to single stimuli showing (D) miniature end-plate potentials (mEPP) size, (E) mEPP frequency, (F) EPP amplitude in response to a single suprathreshold stimulus to the nerve and (G) mean quantal content. No significant difference was detected in mEPP size and frequency between mutant and wild-type junctions (P > 0.05; one-way ANOVA); EPPs and quantal content in SMA NF junctions were significantly increased over wild-type values (P < 0.05; one-way ANOVA). Data represented as mean ± SEM.
Figure 8.
Figure 8.
Motor neuron and motor axon loss in SMA mice. (A) Quantification of myelinated axons in C4-dorsal roots (C4-d), C4-ventral roots (C4-v), PN (phrenic nerves), and L4-ventral roots (L4-v) in P14 Δ7+/+ SMA (S) mice and age-matched Controls (C). Data represented as mean ± SD (n = 3). ‘Asterisk' denotes P < 0.01 (Student's t-test). n.s.: not significant. (B) Transverse sections through the C4 and L4 roots and phrenic nerve from a P14 Δ7+/+ SMA mouse and a Control (Ctrl) indicating selective loss and atrophy of axons in the C4 root and phrenic nerve. Axons in the caudally located L4 root are spared. Scale bar: 100 µm. (C, D) Graphs indicating loss of large caliber axons in the C4 root and phrenic nerve in P14 Δ7+/+ SMA mice. (E) Motor neuron cell body counts indicate a selective and significant loss (∼30%) in the rostral but not caudal spinal cords of P14 Δ7+/+ SMA (S) mice; Controls (C). ‘Asterisk' denotes P < 0.01 (Student's t-test); n = 3. n.s.: not significant.

Similar articles

Cited by

References

    1. Lefebvre S., Burglen L., Reboullet S., Clermont O., Burlet P., Viollet L., Benichou B., Cruaud C., Millasseau P., Zeviani M. Identification and characterization of a spinal muscular atrophy-determining gene. Cell. 1995;80:155–165. - PubMed
    1. Lorson C.L., Hahnen E., Androphy E.J., Wirth B. A single nucleotide in the SMN gene regulates splicing and is responsible for spinal muscular atrophy. Proc. Natl Acad. Sci. USA. 1999;96:6307–6311. - PMC - PubMed
    1. Monani U.R., Lorson C.L., Parsons D.W., Prior T.W., Androphy E.J., Burghes A.H., McPherson J.D. A single nucleotide difference that alters splicing patterns distinguishes the SMA gene SMN1 from the copy gene SMN2. Hum. Mol. Genet. 1999;8:1177–1183. - PubMed
    1. Vitali T., Sossi V., Tiziano F., Zappata S., Giuli A., Paravatou-Petsotas M., Neri G., Brahe C. Detection of the survival motor neuron (SMN) genes by FISH: further evidence for a role for SMN2 in the modulation of disease severity in SMA patients. Hum. Mol. Genet. 1999;8:2525–2532. - PubMed
    1. McAndrew P.E., Parsons D.W., Simard L.R., Rochette C., Ray P.N., Mendell J.R., Prior T.W., Burghes A.H. Identification of proximal spinal muscular atrophy carriers and patients by analysis of SMNT and SMNC gene copy number. Am. J. Hum. Genet. 1997;60:1411–1422. - PMC - PubMed

Publication types

MeSH terms

Substances