Control of antagonistic components of the hedgehog signaling pathway by microRNAs in Drosophila
- PMID: 18493062
- PMCID: PMC2390621
- DOI: 10.1534/genetics.107.083733
Control of antagonistic components of the hedgehog signaling pathway by microRNAs in Drosophila
Abstract
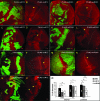
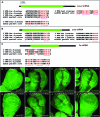
Hedgehog (Hh) signaling is critical for many developmental processes and for the genesis of diverse cancers. Hh signaling comprises a series of negative regulatory steps, from Hh reception to gene transcription output. We previously showed that stability of antagonistic regulatory proteins, including the coreceptor Smoothened (Smo), the kinesin-like Costal-2 (Cos2), and the kinase Fused (Fu), is affected by Hh signaling activation. Here, we show that the level of these three proteins is also regulated by a microRNA cluster. Indeed, the overexpression of this cluster and resulting microRNA regulation of the 3'-UTRs of smo, cos2, and fu mRNA decreases the levels of the three proteins and activates the pathway. Further, the loss of the microRNA cluster or of Dicer function modifies the 3'-UTR regulation of smo and cos2 mRNA, confirming that the mRNAs encoding the different Hh components are physiological targets of microRNAs. Nevertheless, an absence of neither the microRNA cluster nor of Dicer activity creates an hh-like phenotype, possibly due to dose compensation between the different antagonistic targets. This study reveals that a single signaling pathway can be targeted at multiple levels by the same microRNAs.
Figures


Similar articles
-
Phosphorylation of the atypical kinesin Costal2 by the kinase Fused induces the partial disassembly of the Smoothened-Fused-Costal2-Cubitus interruptus complex in Hedgehog signalling.Development. 2007 Oct;134(20):3677-89. doi: 10.1242/dev.011577. Epub 2007 Sep 19. Development. 2007. PMID: 17881487
-
Drosophila miR-960 negatively regulates Hedgehog signaling by suppressing Smoothened, Costal-2 and Fused.Cell Signal. 2013 May;25(5):1301-9. doi: 10.1016/j.cellsig.2013.01.023. Epub 2013 Feb 4. Cell Signal. 2013. PMID: 23385085
-
Drosophila miR-5 suppresses Hedgehog signaling by directly targeting Smoothened.FEBS Lett. 2012 Nov 16;586(22):4052-60. doi: 10.1016/j.febslet.2012.10.008. Epub 2012 Oct 16. FEBS Lett. 2012. PMID: 23085394
-
Regulation of Hedgehog signaling: a complex story.Biochem Pharmacol. 2004 Mar 1;67(5):805-14. doi: 10.1016/j.bcp.2004.01.002. Biochem Pharmacol. 2004. PMID: 15104233 Free PMC article. Review.
-
Transducing the Hedgehog signal across the plasma membrane.Fly (Austin). 2007 Nov-Dec;1(6):333-6. doi: 10.4161/fly.5570. Epub 2007 Nov 15. Fly (Austin). 2007. PMID: 18820483 Review.
Cited by
-
The miR-30 microRNA family targets smoothened to regulate hedgehog signalling in zebrafish early muscle development.PLoS One. 2013 Jun 5;8(6):e65170. doi: 10.1371/journal.pone.0065170. Print 2013. PLoS One. 2013. PMID: 23755189 Free PMC article.
-
microRNA control of cell-cell signaling during development and disease.Cell Cycle. 2008 Aug;7(15):2327-32. doi: 10.4161/cc.6447. Epub 2008 Jun 13. Cell Cycle. 2008. PMID: 18677099 Free PMC article. Review.
-
mir-35 is involved in intestine cell G1/S transition and germ cell proliferation in C. elegans.Cell Res. 2011 Nov;21(11):1605-18. doi: 10.1038/cr.2011.102. Epub 2011 Jun 21. Cell Res. 2011. PMID: 21691303 Free PMC article.
-
Microevolution of nematode miRNAs reveals diverse modes of selection.Genome Biol Evol. 2014 Oct 28;6(11):3049-63. doi: 10.1093/gbe/evu239. Genome Biol Evol. 2014. PMID: 25355809 Free PMC article.
-
miR-9a prevents apoptosis during wing development by repressing Drosophila LIM-only.Dev Biol. 2010 Feb 1;338(1):63-73. doi: 10.1016/j.ydbio.2009.11.025. Epub 2009 Nov 26. Dev Biol. 2010. PMID: 19944676 Free PMC article.
References
-
- Aravin, A. A., M. Lagos-Quintana, A. Yalcin, M. Zavolan, D. Marks et al., 2003. The small RNA profile during Drosophila melanogaster development. Dev. Cell 5 337–350. - PubMed
-
- Bartel, D. P., 2004. MicroRNAs: genomics, biogenesis, mechanism, and function. Cell 116 281–297. - PubMed
-
- Basler, K., and G. Struhl, 1994. Compartment boundaries and the control of Drosophila limb pattern by hedgehog protein. Nature 368 208–214. - PubMed
-
- Brennecke, J., D. R. Hipfner, A. Stark, R. B. Russell and S. M. Cohen, 2003. bantam encodes a developmentally regulated microRNA that controls cell proliferation and regulates the proapoptotic gene hid in Drosophila. Cell 113 25–36. - PubMed
Publication types
MeSH terms
Substances
LinkOut - more resources
Full Text Sources
Molecular Biology Databases
Miscellaneous

