. 2008 May;179(1):497-502.
doi: 10.1534/genetics.107.085019.

Estimation of 2Nes from temporal allele frequency data

Affiliations

Estimation of 2Nes from temporal allele frequency data

Jonathan P Bollback et al. Genetics. 2008 May.

Abstract

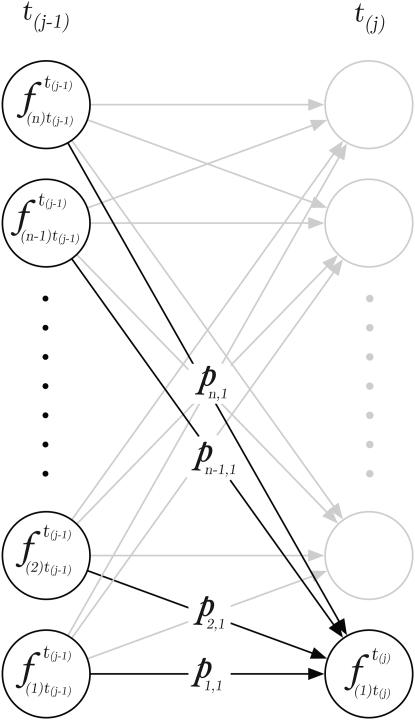
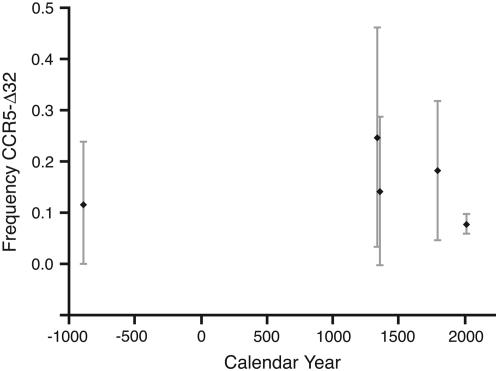
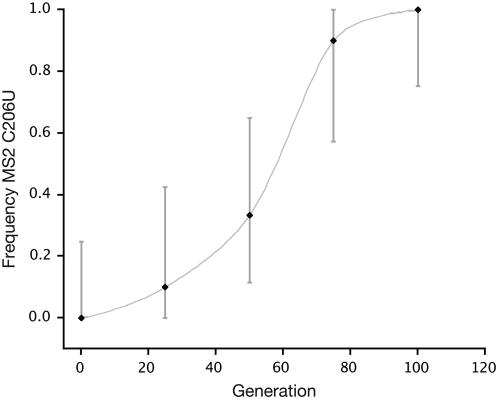
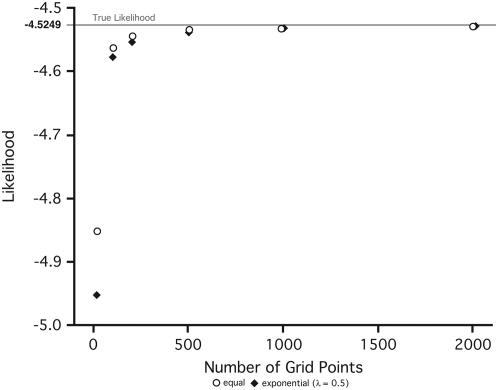
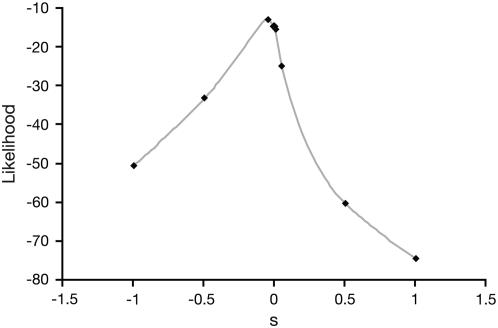
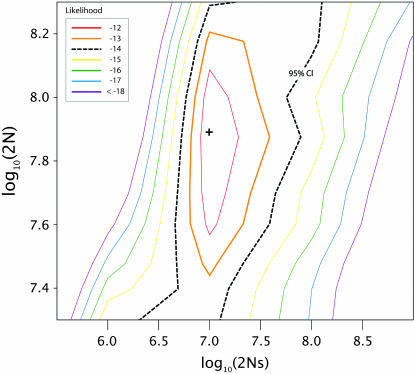
We develop a new method for estimating effective population sizes, Ne, and selection coefficients, s, from time-series data of allele frequencies sampled from a single diallelic locus. The method is based on calculating transition probabilities, using a numerical solution of the diffusion process, and assuming independent binomial sampling from this diffusion process at each time point. We apply the method in two example applications. First, we estimate selection coefficients acting on the CCR5-delta 32 mutation on the basis of published samples of contemporary and ancient human DNA. We show that the data are compatible with the assumption of s = 0, although moderate amounts of selection acting on this mutation cannot be excluded. In our second example, we estimate the selection coefficient acting on a mutation segregating in an experimental phage population. We show that the selection coefficient acting on this mutation is approximately 0.43.


Figures

F<sc>igure</sc> 1.—
Figure 1.—
Graph of the hidden Markov process model (HMM) showing the calculation of formula image. Transition probabilities, px,i = f(x; p, t) from x to 1 are numerically solved using the Crank–Nicholson method (Crank and Nicolson 1947) on a grid of size n.
F<sc>igure</sc> 2.—
Figure 2.—
Time-series data for the CCR5-Δ32 data (Hummel et al. 2005). Binomial confidence intervals are shown as shaded bars.
F<sc>igure</sc> 3.—
Figure 3.—
Time-series data for the bacteriophage C206U mutation (Bollback and Huelsenbeck 2007). Binomial confidence intervals are shown as shaded bars. A predicted smoothed (shaded) curve fitted projection is shown.
F<sc>igure</sc> 4.—
Figure 4.—
Adequacy of the numerical approximations as a function of the number of grid points. Two different grid point spacings are used, equal (open circles) and exponential (solid diamonds) with a spacing parameter of λ = 0.5.
F<sc>igure</sc> 5.—
Figure 5.—
Profile likelihood of the selection coefficient for CCR5-Δ32 (Hummel et al. 2005).
F<sc>igure</sc> 6.—
Figure 6.—
Likelihood surface for the bacteriophage C206U mutation (Bollback and Huelsenbeck 2007). The 95% confidence interval is shown in black with the maximum point on the surface depicted by a plus (+) sign.

References

    1. Anderson, E. C., 2005. An efficient Monte Carlo method for estimating Ne from temporally spaced samples using a coalescent-based likelihood. Genetics 170 955–967. - PMC - PubMed
    1. Anderson, E. C., E. G. Williamson and E. A. Thompson, 2000. Monte Carlo evaluation of the likelihood for Ne from temporally spaced samples. Genetics 156 2109–2118. - PMC - PubMed
    1. Beaumont, M. A., 2003. Estimation of population growth or decline in genetically monitored populations. Genetics 164 1139–1160. - PMC - PubMed
    1. Berthier, P., M. A. Beaumont, J.-M. Cornuet and G. Luikart, 2002. Likelihood-based estimation of the effective population size using temporal changes in allele frequencies: a genealogical approach. Genetics 160 741–751. - PMC - PubMed
    1. Bollback, J. P., and J. P. Huelsenbeck, 2007. Clonal interference is alleviated by high mutation rates in large populations. Mol. Biol. Evol. 24 1397–1406. - PubMed

Publication types

Substances