

Statistical power analysis of neutrality tests under demographic expansions, contractions and bottlenecks with recombination
- PMID: 18493071
- PMCID: PMC2390632
- DOI: 10.1534/genetics.107.083006
Statistical power analysis of neutrality tests under demographic expansions, contractions and bottlenecks with recombination
Abstract
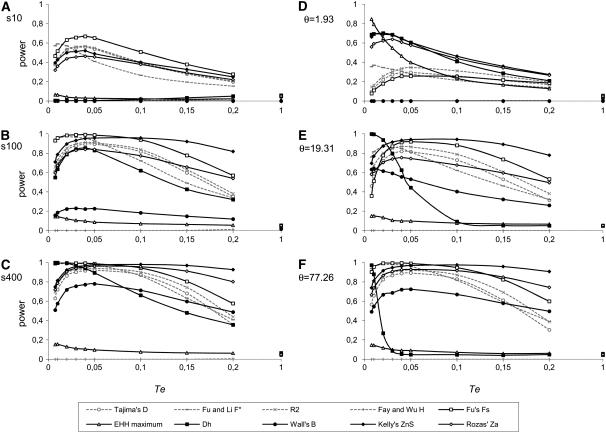
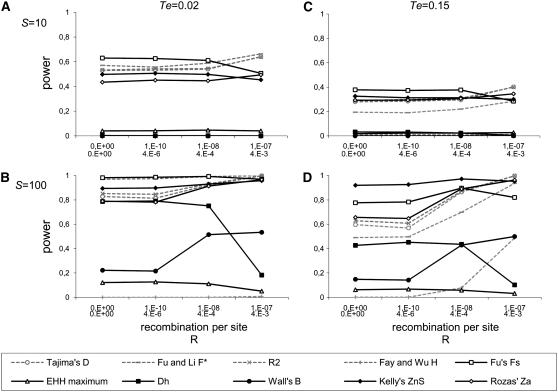
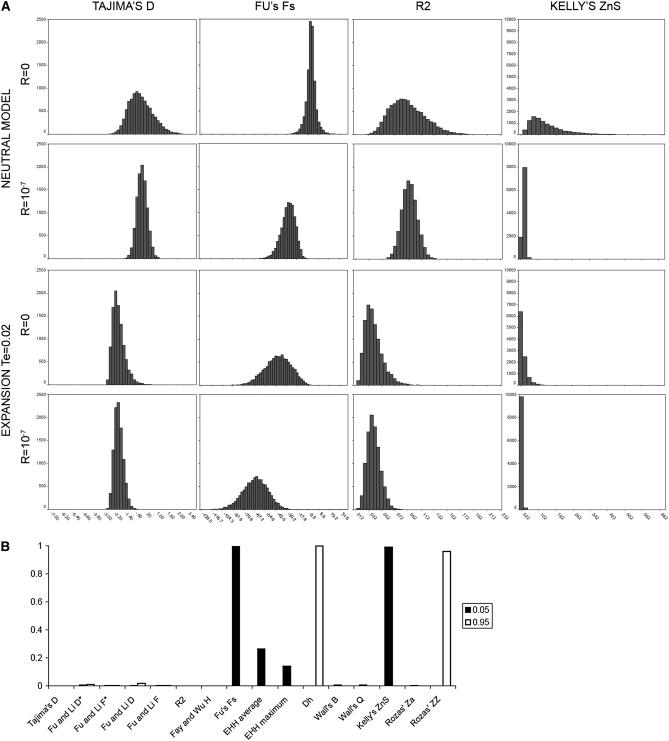
Several tests have been proposed to detect departures of nucleotide variability patterns from neutral expectations. However, very different kinds of evolutionary processes, such as selective events or demographic changes, can produce similar deviations from these tests, thus making interpretation difficult when a significant departure of neutrality is detected. Here we study the effects of demography and recombination upon neutrality tests by analyzing their power under sudden population expansions, sudden contractions, and bottlenecks. We evaluate tests based on the frequency spectrum of mutations and the distribution of haplotypes and explore the consequences of using incorrect estimates of the rates of recombination when testing for neutrality. We show that tests that rely on haplotype frequencies-especially Fs and ZnS, which are based, respectively, on the number of different haplotypes and on the r2 values between all pairs of polymorphic sites-are the most powerful for detecting expansions on nonrecombining genomic regions. Nevertheless, they are strongly affected by misestimations of recombination, so they should not be used when recombination levels are unknown. Instead, class I tests, particularly Tajima's D or R2, are recommended.
Figures

References
-
- Crawford, D. C., D. T. Akey and D. A. Nickerson, 2005. The patterns of natural variation in human genes. Annu. Rev. Genomics Hum. Genet. 6 287–312. - PubMed
-
- Depaulis, F., S. Mousset and M. Veuille, 2001. Haplotype tests using coalescent simulations conditional on the number of segregating sites. Mol. Biol. Evol. 18 1136–1138. - PubMed
-
- Depaulis, F., S. Mousset and M. Veuille, 2003. Power of neutrality tests to detect bottlenecks and hitchhiking. J. Mol. Evol. 57(Suppl. 1): 190–200. - PubMed
-
- Depaulis, F., S. Mousset and M. Veuille, 2005. Detecting selective sweeps with haplotype tests, pp. 34–54 in Selective Sweep, edited by D. Nurminsky. Landes Bioscience, Georgetown, TX.
Publication types
MeSH terms
LinkOut - more resources
Full Text Sources
