Comparative Study
. 2008 May;179(1):569-79.
doi: 10.1534/genetics.107.084277.

Linkage disequilibrium decay and haplotype block structure in the pig

Affiliations
Comparative Study

Linkage disequilibrium decay and haplotype block structure in the pig

Andreia J Amaral et al. Genetics. 2008 May.

Abstract

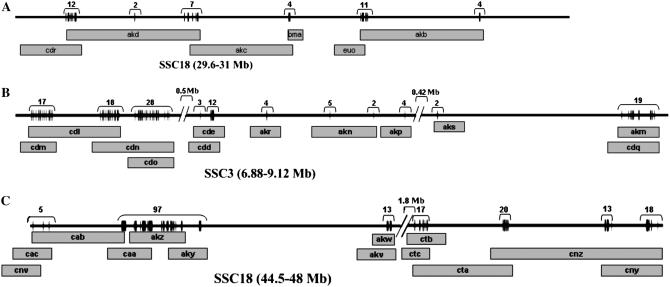
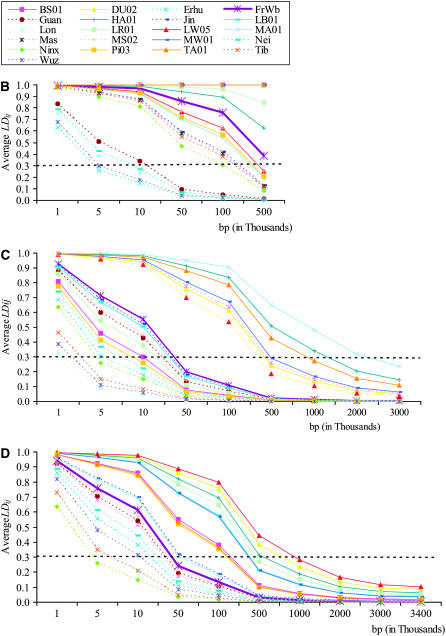
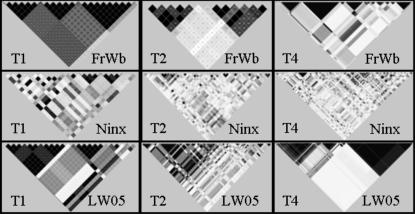
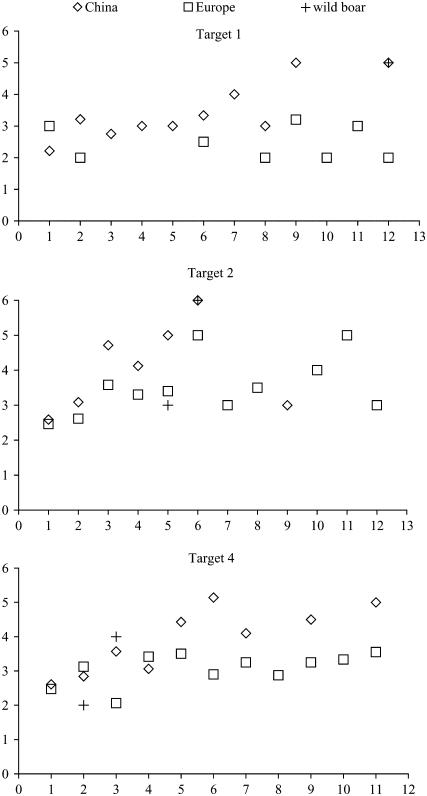
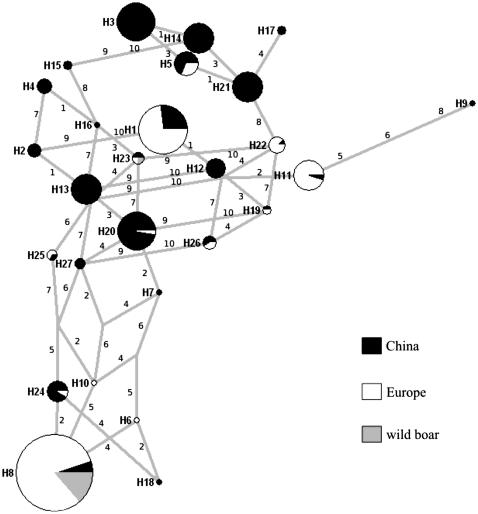
Linkage disequilibrium (LD) may reveal much about domestication and breed history. An investigation was conducted, to analyze the extent of LD, haploblock partitioning, and haplotype diversity within haploblocks across several pig breeds from China and Europe and in European wild boar. In total, 371 single-nucleotide-polymorphisms located in three genomic regions were genotyped. The extent of LD differed significantly between European and Chinese breeds, extending up to 2 cM in Europe and up to 0.05 cM in China. In European breeds, LD extended over large haploblocks up to 400 kb, whereas in Chinese breeds the extent of LD was smaller and generally did not exceed 10 kb. The European wild boar showed an intermediate level of LD between Chinese and European breeds. In Europe, the extent of LD also differed according to genomic region. Chinese breeds showed a higher level of haplotype diversity and shared high levels of frequent haplotypes with Large White, Landrace, and Duroc. The extent of LD differs between both centers of pig domestication, being higher in Europe. Two hypotheses can explain these findings. First, the European ancestral stock had a higher level of LD. Second, modern breeding programs increased the extent of LD in Europe and caused differences of LD between genomic regions. Large White, Landrace, and Duroc showed evidence of past introgression from Chinese breeds.


Figures

F<sc>igure</sc> 1.—
Figure 1.—
SNPs distribution by genomic region. (A) Target 1, (B) target 2, and (C) target 4. SNP positions are indicated by vertical tick marks, and numbers indicate total number of SNPs in a region. BACs are named according to NISC code and are indicated by horizontal bars. Accession numbers and clone names of the BACs are in supplemental Table 1.
F<sc>igure</sc> 2.—
Figure 2.—
Predicted LD and physical distance in the three genomic regions. (A) For each genomic region, the relationship between average predicted LD (LDij) and genomic distance (bp) is shown per biogeographical region. Vertical bars represent the standard error. The relationship between predicted LD (LDij) and distance (base pairs) is shown per breed and per genomic region: target 1 (B), target 2 (C), and target 4 (D). Chinese breeds are represented by dashed lines, European breeds are represented by solid lines, and wild boar is represented by a thick solid line. In target 1, observed r2 is 1 for breeds Tamworth, Duroc, Middle White British Saddleback, and Large Black. Therefore predicted values were not estimated for these breeds and B shows observed r2.
F<sc>igure</sc> 3.—
Figure 3.—
Comparison of LD between genomic regions: T1, target 1; T2, target 2; and T4, target 4. Pairwise LD (observed r2) plots are shown for Ningxiang (Ninx) and Large White (LW05) as an example of the LD in the two main centers of pig domestication (Europe and China) and for the European wild boar representing the ancestral European population: white areas, r2 = 0; shades of gray, 0 < r2 < 1; and black areas, r2 = 1.
F<sc>igure</sc> 4.—
Figure 4.—
Comparison of haplotype diversity per genomic region. The number of haplotypes per haploblock is plotted against the number of SNPs in each haploblock for each genomic region (target 1, target 2, and target 4) for Europe and China and for the European wild boar.
F<sc>igure</sc> 5.—
Figure 5.—
Median-joining network of the SNP-based haplotypes from target 2, block 1. In each circle (identified as a solid area), haplotype frequencies in European and Chinese breeds and in European wild boar are shown. The circle area is proportional to frequency and branch length is proportional to the number of mutations. Each line is annotated with its corresponding mutational change (corresponding to the SNP ID in supplemental Table 2).

References

    1. Aerts, J., H. J. Megens, T. Veenendaal, I. Ovcharenko, R. Crooijmans et al., 2007. Extent of linkage disequilibrium in chicken. Cytogenet. Genome Res. 117 338–345. - PubMed
    1. Altschul, S. F., W. Gish, W. Miller, E. W. Myers and D. J. Lipman, 1990. Basic local alignment search tool. J. Mol. Biol. 215 403–410. - PubMed
    1. Ardlie, K. G., L. Kruglyak and M. Seielstad, 2002. Patterns of linkage disequilbrium in the human genome. Nat. Rev. Genet. 3 299–309 (erratum: Nat. Rev. Genet. 3: 566. - PubMed
    1. Baessler, A., M. Fischer, B. Mayer, M. Koehler, S. Wiedmann et al., 2007. Epistatic interaction between haplotypes of the ghrelin ligand and receptor genes influence susceptibility to myocardial infarction and coronary artery disease. Hum. Mol. Genet. 16 887–899. - PubMed
    1. Bandelt, H. J., P. Forster and A. Rohl, 1999. Median-joining networks for inferring intraspecific phylogenies. Mol. Biol. Evol. 16 37–48. - PubMed

Publication types