

Social vulnerability, frailty and mortality in elderly people
- PMID: 18493324
- PMCID: PMC2375054
- DOI: 10.1371/journal.pone.0002232
Social vulnerability, frailty and mortality in elderly people
Abstract
Background: Social vulnerability is related to the health of elderly people, but its measurement and relationship to frailty are controversial. The aims of the present study were to operationalize social vulnerability according to a deficit accumulation approach, to compare social vulnerability and frailty, and to study social vulnerability in relation to mortality.
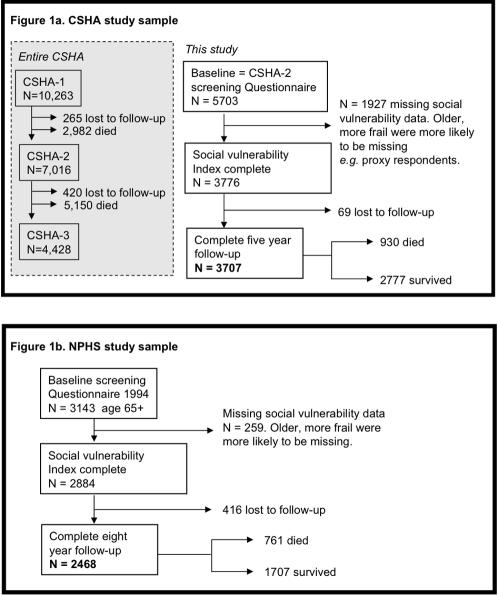
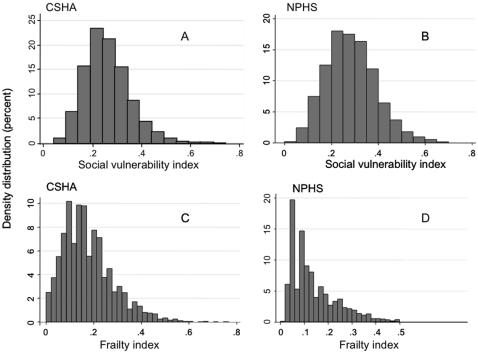
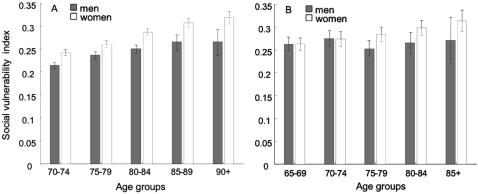
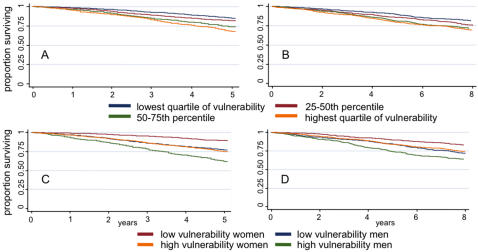
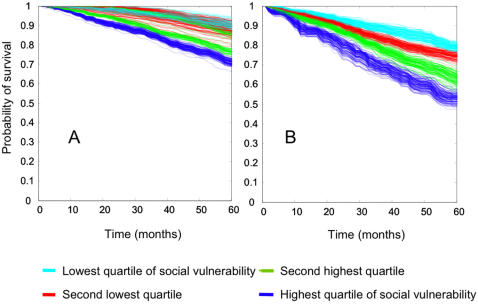
Methods and findings: This is a secondary analysis of community-dwelling elderly people in two cohort studies, the Canadian Study of Health and Aging (CSHA, 1996/7-2001/2; N = 3707) and the National Population Health Survey (NPHS, 1994-2002; N = 2648). Social vulnerability index measures that used self-reported items (23 in NPHS, 40 in CSHA) were constructed. Each measure ranges from 0 (no vulnerability) to 1 (maximum vulnerability). The primary outcome measure was mortality over five (CHSA) or eight (NPHS) years. Associations with age, sex, and frailty (as measured by an analogously constructed frailty index) were also studied. All individuals had some degree of social vulnerability. Women had higher social vulnerability than men, and vulnerability increased with age. Frailty and social vulnerability were moderately correlated. Adjusting for age, sex, and frailty, each additional social 'deficit' was associated with an increased odds of mortality (5 years in CSHA, odds ratio = 1.05, 95% confidence interval: 1.02-1.07; 8 years in the NPHS, odds ratio = 1.08, 95% confidence interval: 1.03-1.14). We identified a meaningful survival gradient across quartiles of social vulnerability, and although women had better survival than men, survival for women with high social vulnerability was equivalent to that of men with low vulnerability.
Conclusions: Social vulnerability is reproducibly related to individual frailty/fitness, but distinct from it. Greater social vulnerability is associated with mortality in older adults. Further study on the measurement and operationalization of social vulnerability, and of its relationships to other important health outcomes, is warranted.
Conflict of interest statement
Figures
References
-
- Seeman TE, Berkman LF, Kohout F, Lacroix A, Glynn R, et al. Intercommunity variations in the association between social ties and mortality in the elderly. A comparative analysis of three communities. Ann Epidemiol. 1993;3(4):325–335. - PubMed
-
- Seeman TE, Kaplan GA, Knudsen L, Cohen R, Guralnik J. Social network ties and mortality among the elderly in the Alameda County Study. Am J Epidemiol. 1987;126(4):714–723. - PubMed
-
- Blazer DG. Social support and mortality in an elderly community population. Am J Epidemiol. 1982;115(5):684–694. - PubMed
-
- Schoenbach VJ, Kaplan BH, Fredman L, Kleinbaum DG. Social ties and mortality in Evans County, Georgia. Am J Epidemiol. 1986;123(4):577–591. - PubMed
-
- Bassuk SS, Glass TA, Berkman LF. Social disengagement and incident cognitive decline in community-dwelling elderly persons. Ann Intern Med. 1999;131(3):165–173. - PubMed
Publication types
MeSH terms
LinkOut - more resources
Full Text Sources
Medical
