. 2008 May 21;3(5):e2212.
doi: 10.1371/journal.pone.0002212.

Understanding the impact of male circumcision interventions on the spread of HIV in southern Africa

Affiliations

Understanding the impact of male circumcision interventions on the spread of HIV in southern Africa

Timothy B Hallett et al. PLoS One. .

Abstract

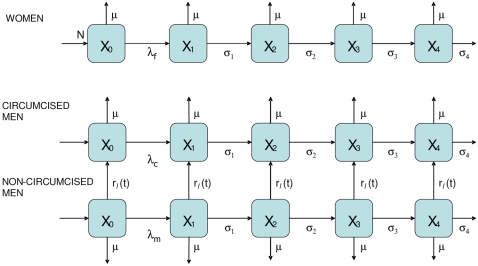
Background: Three randomised controlled trials have clearly shown that circumcision of adult men reduces the chance that they acquire HIV infection. However, the potential impact of circumcision programmes--either alone or in combination with other established approaches--is not known and no further field trials are planned. We have used a mathematical model, parameterised using existing trial findings, to understand and predict the impact of circumcision programmes at the population level.

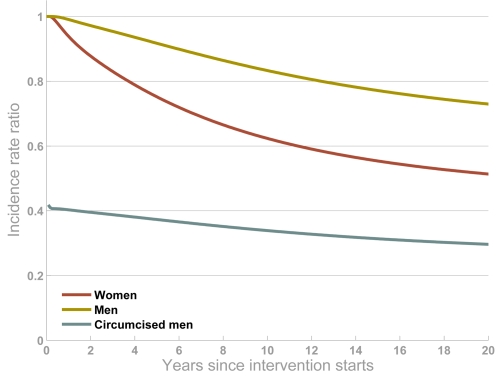
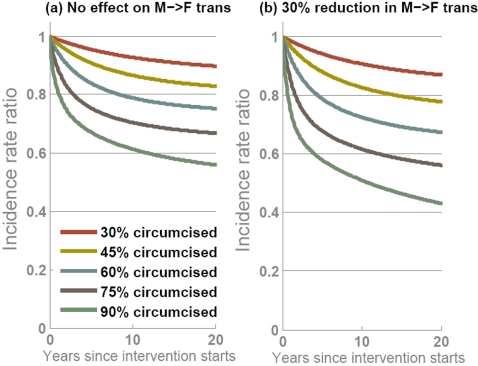
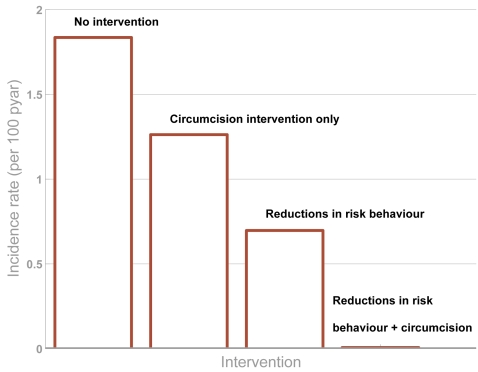
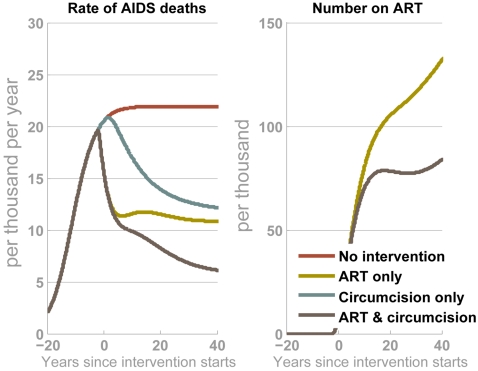
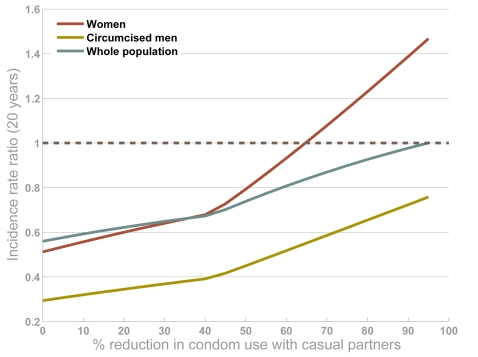
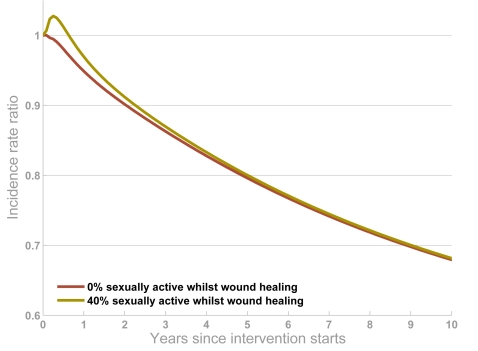
Findings: Our results indicate that circumcision will lead to reductions in incidence for women and uncircumcised men, as well as those circumcised, but that even the most effective intervention is unlikely to completely stem the spread of the virus. Without additional interventions, HIV incidence could eventually be reduced by 25-35%, depending on the level of coverage achieved and whether onward transmission from circumcised men is also reduced. However, circumcision interventions can act synergistically with other types of prevention programmes, and if efforts to change behaviour are increased in parallel with the scale-up of circumcision services, then dramatic reductions in HIV incidence could be achieved. In the long-term, this could lead to reduced AIDS deaths and less need for anti-retroviral therapy. Any increases in risk behaviours following circumcision, i.e. 'risk compensation', could offset some of the potential benefit of the intervention, especially for women, but only very large increases would lead to more infections overall.

Conclusions: Circumcision will not be the silver bullet to prevent HIV transmission, but interventions could help to substantially protect men and women from infection, especially in combination with other approaches.


Conflict of interest statement

Competing Interests: The authors have declared that no competing interests exist.

Figures

Figure 1
Figure 1. Flow diagram of model.
The model population is divided into females, circumcised males and non-circumcised males. In each group, X0 is the number of individuals not infected, X1 is the number with acute HIV infection, X2 is the number with latent infection, X3 is the number of people in a stage shortly prior to AIDS and X4 is the number with AIDS. The rate of progression between these stages of infection is given by σ1, σ2 and σ3 and the rate of death for those with AIDS is σ4; on average, individuals have acute infection for four months, latent infection for eight years, ‘pre-AIDS’ for twelve months and AIDS for six months. The rate of incidence among females, circumcised and non-circumcised men are represented by λf, λc and λm respectively. The intervention is simulated by moving non-circumcised men into the group of circumcised men, at a rate which can be different for men who are infected from those who are not or different in the different sexual activity groups (not shown): rs(t).
Figure 2
Figure 2. Impact of the intervention among women (red line), uncircumcised men (yellow line) and circumcised men (blue line) (90% circumcision coverage achieved).
The output is the ratio of HIV incidence when the intervention is simulated relative to the projection with no intervention. In these simulations, the operation wound is assumed to heal instantaneously.
Figure 3
Figure 3. Projected impact of male circumcision interventions over time with different levels of coverage achieved if, (a) circumcised men are 60% less likely to get infected but there is no effect on male-to-female transmission; and, (b) circumcised men are 60% less likely to get infected and circumcised men are 30% less likely to transmit infection.
In each panel, five epidemic projections show circumcision interventions with 30% (red line), 45% (yellow line), 60% (blue line), 75% (brown line) or 90% (green line) of men being circumcised. The output is the ratio of HIV incidence when the intervention is simulated relative to the projection with no intervention. Endemic HIV prevalence before the intervention is 23%.
Figure 4
Figure 4. Interaction of circumcision interventions with existing behaviour change programmes.
Four epidemic projections show: (i) no interventions, (ii) circumcision intervention with 90% coverage, (iii) a behaviour change intervention that leads to an average 30% reduction in partner change rate and 30% increase in condom use with casual partners, (iv) both the circumcision intervention and the behaviour change intervention. The output is HIV incidence per 100 person-years at risk (pyar). The time-scale relates to years since the circumcision intervention starts. (Note: Unlike in other simulations, here no compensation is made for the potential effects of AIDS mortality modifying the risk distribution in the population (see text S1 for details)).
Figure 5
Figure 5. Comparison of circumcision interventions and ART.
Four epidemic projections show (i) no interventions (red line), (ii) ART provided to up to 90% of those in need (yellow line), (iii) circumcision intervention with 90% coverage (blue line), (iv) both the ART and the circumcision intervention (brown line). The outputs are the annual rate of AIDS death (per 1000) and the number receiving ART (per 1000 population when the intervention starts). The time-scale relates to years since the circumcision intervention starts. The fraction of individuals that can start treatment increases from 0% two years before the circumcision intervention starts (which we take to be approximately equal to calendar year 2005) to 28% within two years (i.e. 2007) – this is typical for sub-Saharan Africa . We assume that ART coverage will plateau at 90% by 2020.
Figure 6
Figure 6. The impact of risk compensation by circumcised men.
Men that are circumcised in the intervention are assumed to reduce the chance they use condom with casual partners (originally 0.6 [8], [37]) by between 0 (no change) and 100% (no condom use at all with causal partners). The output is the ratio of HIV incidence twenty years after the intervention starts among women (red line), circumcised men (yellow line), and the population overall (blue line) when the intervention is simulated relative to the projection with no intervention. A value greater than 1 indicates that incidence is higher with the intervention. It is assumed that 90% of men are circumcised in the intervention.
Figure 7
Figure 7. The impact of the wound healing period and circumcising infected men.
The projections show the impact of a circumcision intervention with 90% of men being circumcised if it is assumed that the chance of transmission from circumcised men to women is twice as high during the two-month healing period, and 0% of circumcised men (red line) or 40% of men (yellow line) are sexually active whilst the wound heals (yellow line). The output is the ratio of HIV incidence when the intervention is simulated relative to the projection with no intervention.

References

    1. UNAIDS, WHO. AIDS Epidemic Update. 2007 (available from http://dataunaidsorg/pub/EPISlides/2007/2007_epiupdate_enpdf).
    1. UNAIDS. Geneva, Switzerland: 1999. Trends in HIV incidence and prevalence: natural course of the epidemic or results of behavioural change?
    1. Kilian AH, Gregson S, Ndyanabangi B, Walusaga K, Kipp W, et al. Reductions in risk behaviour provide the most consistent explanation for declining HIV-1 prevalence in Uganda. Aids. 1999;13:391–398. - PubMed
    1. Stoneburner RL, Low-Beer D. Population-level HIV declines and behavioral risk avoidance in Uganda. Science. 2004;304:714–718. - PubMed
    1. Hallett TB, Aberle-Grasse J, Bello G, Boulos LM, Cayemittes MPA, et al. Declines in HIV prevalence can be associated with changing sexual behaviour in Uganda, urban Kenya, Zimbabwe, and urban Haiti. Sex Transm Infect. 2006;82:i1–8. - PMC - PubMed

Publication types