. 2008 May 21;3(5):e2236.
doi: 10.1371/journal.pone.0002236.

Antagomir-17-5p abolishes the growth of therapy-resistant neuroblastoma through p21 and BIM

Affiliations

Antagomir-17-5p abolishes the growth of therapy-resistant neuroblastoma through p21 and BIM

Laura Fontana et al. PLoS One. .

Abstract

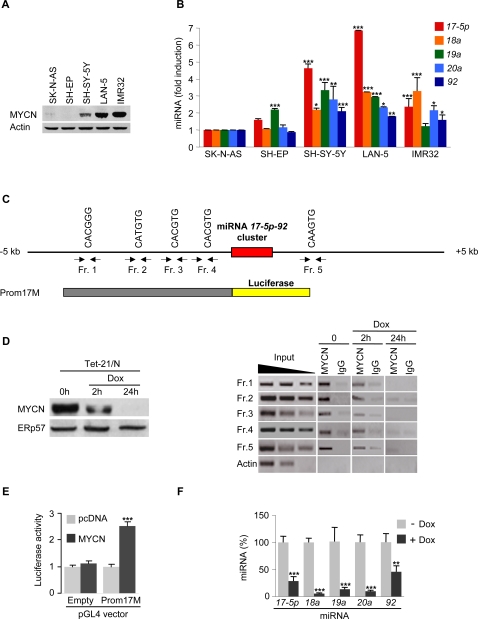
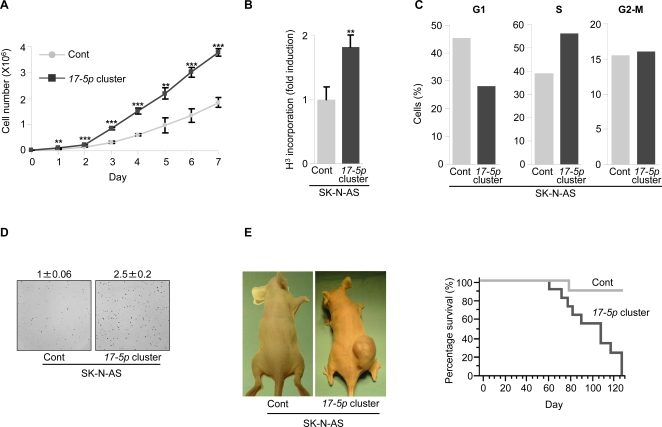
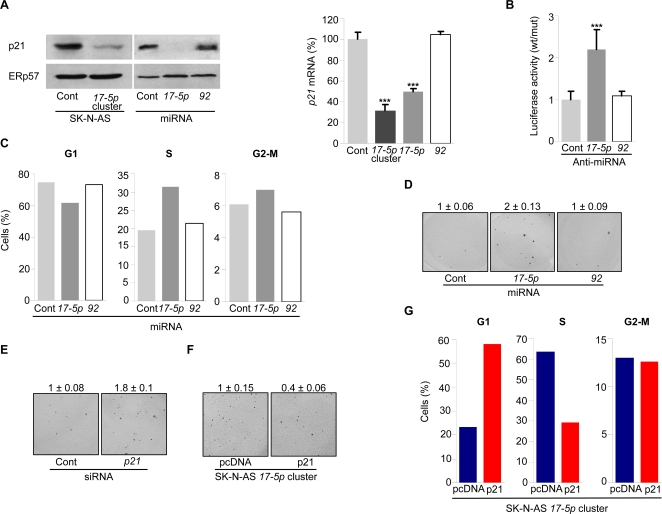
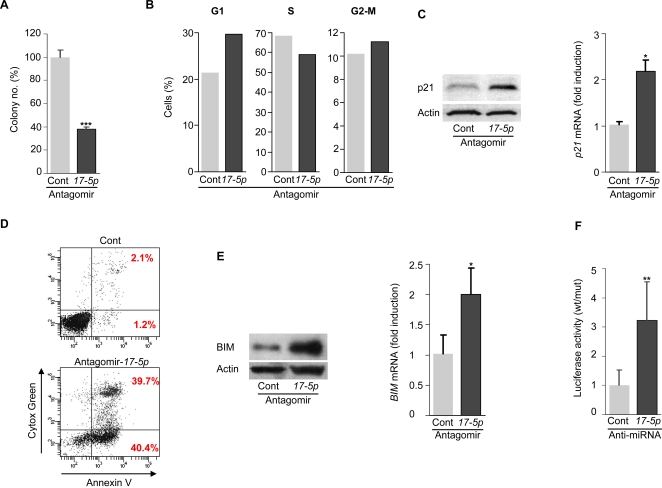
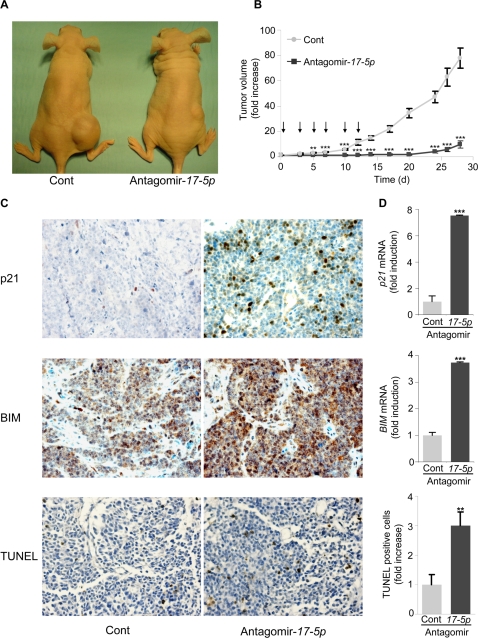
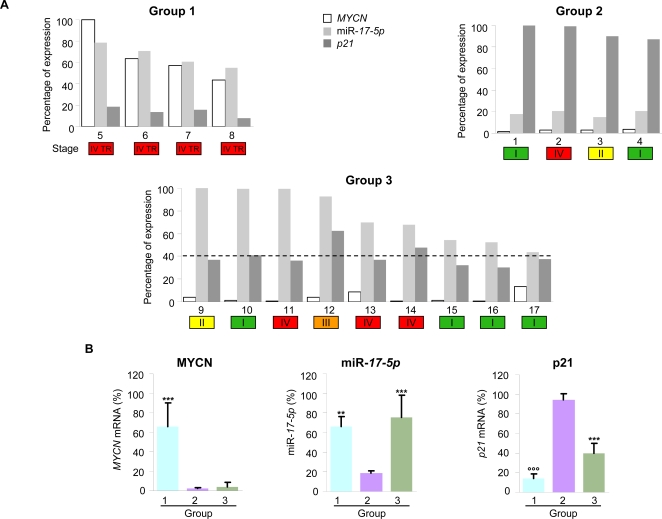
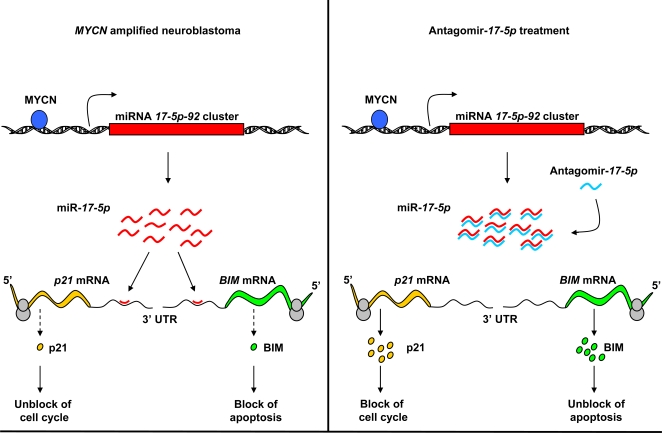
We identified a key oncogenic pathway underlying neuroblastoma progression: specifically, MYCN, expressed at elevated level, transactivates the miRNA 17-5p-92 cluster, which inhibits p21 and BIM translation by interaction with their mRNA 3' UTRs. Overexpression of miRNA 17-5p-92 cluster in MYCN-not-amplified neuroblastoma cells strongly augments their in vitro and in vivo tumorigenesis. In vitro or in vivo treatment with antagomir-17-5p abolishes the growth of MYCN-amplified and therapy-resistant neuroblastoma through p21 and BIM upmodulation, leading to cell cycling blockade and activation of apoptosis, respectively. In primary neuroblastoma, the majority of cases show a rise of miR-17-5p level leading to p21 downmodulation, which is particularly severe in patients with MYCN amplification and poor prognosis. Altogether, our studies demonstrate for the first time that antagomir treatment can abolish tumor growth in vivo, specifically in therapy-resistant neuroblastoma.


Conflict of interest statement

Competing Interests: The authors have declared that no competing interests exist.

Figures

Figure 1
Figure 1. MYCN transactivates the miRNA 17-5p-92 cluster in neuroblastoma by directly binding to its promoter.
(A) Western blot of MYCN in different neuroblastoma cell lines. A representative experiment is shown. (B) miRNA qRT-PCR analysis of miRNAs pertaining to the miRNA 17-5p-92 cluster in different neuroblastoma cell lines. The level of each miRNA is normalized to its expression in SK-N-AS cells (set as 1). Mean±s.d. (n = 3). (C) Schematic representation of the genomic region encompassing the miRNA 17-5p-92 cluster. Five putative MYCN binding sites (included in fragments 1, 2, 3, 4, 5) are indicated. (D) Left panel. Representative Western blot of MYCN in Tet-21/N cells untreated (0 h) or treated with doxycycline (Dox) for 2 or 24 h. ERp57 was used for normalization. Right panel. Chromatin immunoprecipitation with an anti-MYCN or a control anti-IgG antibodies on lysates from Tet-21/N cells untreated or treated with doxycycline for the indicated times. Control amplifications were carried out on either chromatin before immunoprecipitation (Input) or immunoprecipitated chromatin with oligonucleotides amplifying the β-actin gene (Actin). (E) Promoter assay with the pGL4Prom17M construct containing a 3731 bp fragment of the miRNA 17-5p-92 cluster promoter upstream the luciferase gene (indicated in C). SH-EP cells were transfected with pGL4 vector (Empty) or pGL4Prom17M (Prom17M) in combination with pcDNA3 (pcDNA) or piRV-neoSV-MYCN and luciferase activity was measured 72 h post-transfection. The bars represent the normalized luciferase activity (mean±s.d., n = 5). (F) miRNA qRT-PCR analysis of miRNAs pertaining to the miRNA 17-5p-92 cluster in Tet-21/N untreated (− Dox) or treated with doxycycline for 96 h (+ Dox). The level of each miRNA is reported as percentage of its expression in untreated cells (set as 100%). Mean±s.d. (n = 3). * P<0.05, ** P<0.01, *** P<0.001.
Figure 2
Figure 2. Overexpression of miRNA 17-5p-92 cluster augments in vitro and in vivo tumorigenesis of SK-N-AS cells.
(A) Proliferation curve of SK-N-AS stably transfected with the empty vector (Cont) or the vector expressing the miRNA 17-5p-92 cluster (17-5p cluster). Mean±s.d. (n = 3). (B) Thymidine incorporation in SK-N-AS Cont or 17-5p cluster cells. Mean±s.d. (n = 3). (C) Cell cycle analysis of SK-N-AS Cont or 17-5p cluster cells. After 30 h starvation, cells were incubated with a complete medium for 16 h before BrdU incorporation and FACS analysis. Percentage of cells in G1, S or G2-M phase of the cell cycle is indicated. A representative experiment is shown. (D) Anchorage independent growth of SK-N-AS Cont or 17-5p cluster cells. Cells were plated in a soft agar semisolid medium and colonies were counted after 2 weeks. In each experiment, cells were plated in triplicate. Representative fields are shown. Numbers indicate the fold increase of the colony number formed by SK-N-AS 17-5p cluster cells relative to SK-N-AS Cont cells (set as 1). Mean±s.d. (n = 5); P<0.001. (E) Left panel. Nude mice were injected with SK-N-AS Cont or 17-5p cluster cells and photographed four months after the injection. Representative mice are shown. Right panel. Kaplan-Meier curves showing survival of mice injected with SK-N-AS Cont (grey line) or 17-5p cluster cells (black line); P<0.05 (n = 11). ** P<0.01, *** P<0.001.
Figure 3
Figure 3. miR-17-5p mediates the oncogenic function of miRNA 17-5p-92 cluster through p21 and cell cycle regulation.
(A) Western blot (left panel) and qRT-PCR (right panel) of p21 expression in SK-N-AS Cont or 17-5p cluster cells, or in SK-N-AS transiently transfected with miR-17-5p, -92 or a control miRNA. A representative Western blot is shown. Mean±s.d. (n = 3). (B) Luciferase activity in Tet-21/N cells transfected with pGL3-prom-p21UTR wt or mut in combination with a control or anti-miRNA oligonucleotides complementary to miR-17-5p or -92. The ratio of normalized luciferase activity in pGL3-prom-p21UTR wt versus mut transfected cells is indicated. Mean±s.d. (n = 6). (C) Cell cycle analysis of SK-N-AS cells transfected with miR-17-5p, -92 or a control miRNA. After transfection, cells were starved for 30 h and then incubated with a complete medium for 16 h before BrdU incorporation and FACS analysis. Percentage of cells in G1, S or G2-M phase of the cell cycle is indicated. A representative experiment is shown. (D) Anchorage independent growth of SK-N-AS cells transfected with miRNA-17-5p, -92 or a control miRNA. Cells were plated in a soft agar semisolid medium and colonies were counted after 2 weeks. In each experiment, cells were plated in triplicate. A representative field is shown. Numbers indicate the fold increase of the colony number formed by SK-N-AS transfected with miR-17-5p or -92 relative to SK-N-AS cells transfected with a control miRNA (set as 1). Mean±s.d. (n = 3); P<0.001. (E) Colony formation of SK-N-AS cells transfected with siRNA targeting p21 mRNA (p21 siRNA) or a control oligonucleotide (Cont siRNA). After transfection, cells were plated in a soft agar semisolid medium and colonies were counted after 2 weeks. In each experiment, cells were plated in triplicate. A representative field is shown. Numbers indicate the fold increase of the colony number formed by SK-N-AS transfected with p21 siRNA relative to SK-N-AS cells transfected with a control siRNA (set as 1). Mean±s.d. (n = 3); P<0.001. (F) Colony formation of SK-N-AS 17-5p cluster cells stably transfected with an expression vector for p21 or the empty plasmid (pcDNA). Cells were plated in a soft agar semisolid medium and colonies were counted after 2 weeks. In each experiment, cells were plated in triplicate. A representative field is shown. Numbers indicate the fold increase of the colony number formed by SK-N-AS 17-5p cluster cells transfected with an expression vector for p21 relative to cells transfected with the empty plasmid (set as 1). Mean±s.d. (n = 3); P<0.001. (G) Cell cycle analysis of SK-N-AS 17-5p cluster cells stably transfected with an expression vector for p21 or the empty plasmid (pcDNA). Cells were starved for 24 h and then incubated with a complete medium for 16 h before BrdU incorporation and FACS analysis. Percentage of cells in G1, S or G2-M phase of the cell cycle is indicated. A representative experiment is shown. *** P<0.001.
Figure 4
Figure 4. Treatment of MYCN-amplified LAN-5 cells with antagomir-17-5p inhibits in vitro tumorigenesis through p21 and BIM upmodulation.
(A) Colony formation of LAN-5 cells treated with antagomir-17-5p or a control antagomir. 24 h after treatment, cells were plated in a soft agar semisolid medium and colonies were counted after 2 weeks. In each experiment, cells were plated in triplicate. Mean±s.d. (n = 3). (B) Cell cycle analysis of LAN-5 cells treated with antagomir-17-5p or a control antagomir. After treatment, cells were starved for 24 h and then incubated with a complete medium for 16 h before BrdU incorporation and FACS analysis. Percentage of cells in G1, S or G2-M phase of the cell cycle is indicated. A representative experiment is shown. (C) Western blot (left panel) and qRT-PCR (right panel) of p21 expression in LAN-5 cells treated with antagomir-17-5p or a control antagomir. A representative Western blot is shown. Mean±s.d. (n = 3). (D) Apoptosis of LAN-5 cells treated with antagomir-17-5p or a control antagomir. 24 h after treatment, cells were incubated with Annexin V and Cytox Green and analyzed by FACS. A representative experiment is shown. (E) Western blot (left panel) and qRT-PCR (right panel) of BIM expression in LAN-5 cells treated with antagomir-17-5p or a control antagomir. A representative Western blot is shown. Mean±s.d. (n = 3). (F) Luciferase activity in Tet-21/N cells transfected with pGL3-prom-BIMUTR wt or mut in combination with a control or an anti-miRNA oligonucleotide complementary to miR-17-5p. The ratio of normalized luciferase activity in pGL3-prom-BIMUTR wt versus mut transfected cells is indicated. Mean±s.d. (n = 6). * P<0.05, ** P<0.01, *** P<0.001.
Figure 5
Figure 5. Treatment of MYCN-amplified LAN5 cells with antagomir-17-5p inhibits in vivo tumorigenesis through p21 and BIM upmodulation.
(A) Nude mice were injected with MYCN-amplified LAN-5 cells and treated when tumors reached 150 mm3 with antagomir-17-5p or a control antagomir for 2 weeks. Representative mice were photographed four weeks after the first injection. (B) Growth curves of LAN-5 tumors treated with antagomir-17-5p or a control antagomir for 2 weeks (injections of antagomirs are indicated by arrows). The volume of the tumors was measured three times weekly and is plotted as the fold increase relative to the day of the first antagomir injection (day 0), set as 1. Mean±s.e.m. (n = 11 for cont; n = 10 for Antagomir-17-5p). (C) Immunohistochemistry on LAN-5 tumors treated with antagomir-17-5p or a control antagomir for 24 h. Sections derived from tumors were incubated with an anti-p21 antibody (upper panels), an anti-BIM antibody (middle panels) or with TUNEL for detection of apoptotic cells (lower panels). Representative fields are shown. (D) qRT-PCR of p21 (upper panel) or BIM (middle panel) mRNA levels in tumors formed by LAN-5 cells and treated with antagomir-17-5p or a control antagomir for 24 h. Mean±s.d. (n = 3). Lower panel. TUNEL positive cells in tumors treated with antagomir-17-5p or a control antagomir for 24 h. Mean±s.e.m. (n = 16). ** P<0.01, *** P<0.001.
Figure 6
Figure 6. miR-17-5p expression is correlated to MYCN and p21 levels in human primary neuroblastomas.
(A) Expression of MYCN, miR-17-5p and p21 was analyzed in primary tumors by qRT-PCR. Depending on the expression levels of MYCN and miR-17-5p, primary tumors were divided into three groups. Group 1 (left upper panel) includes MYCN-amplified tumors displaying high levels of miR-17-5p and very low levels of p21. Group 2 (right upper panel) includes MYCN-not-amplified tumors expressing low levels of miR-17-5p and high levels of p21. Group 3 (lower panel) includes MYCN-not-amplified tumors expressing high levels of miR-17-5p and moderately low levels of p21 (a 40% decrease baseline is shown). The coloured boxes indicate the tumor stage (from I to IV) and the therapy resistant tumors (TR). (B) Expression of MYCN, miR-17-5p and p21 in the three groups of primary tumors. Mean±s.d.. ** P<0.01, *** P<0.001 when compared to second group; °°° P<0.001 when compared to the other groups.
Figure 7
Figure 7. Mechanism of antagomir-17-5p action in the treatment of MYCN-amplified neuroblastoma.
In MYCN-amplified neuroblatoma, MYCN binds the miRNA 17-5p-92 cluster promoter and transactivates the miR-17-5p. High levels of miR-17-5p inhibit the translation of p21 and BIM through the direct binding to their mRNA 3′ UTRs. Low levels of p21 and BIM lead to an accelerated cell cycle progression and a resistance to apoptosis, respectively. Treatment of MYCN-amplified cells with antagomir-17-5p inhibits miR-17-5p function, thus allowing the translation of both p21 and BIM mRNA. High levels of p21 and BIM cause a block of cell cycle and induction of apoptosis, respectively, thus inhibiting tumor growth.

References

    1. He L, Hannon GJ. MicroRNAs: small RNAs with a big role in gene regulation. Nat Rev Genet. 2004;5:522–531. - PubMed
    1. Bartel DP. MicroRNAs: genomics, biogenesis, mechanism, and function. Cell. 2004;116:281–297. - PubMed
    1. Zhao Y, Srivastava D. A developmental view of microRNA function. Trends Biochem Sci. 2007;32:189–197. - PubMed
    1. Valencia-Sanchez MA, Liu J, Hannon GJ, Parker R. Control of translation and mRNA degradation by miRNAs and siRNAs. Genes Dev. 2006;20:515–524. - PubMed
    1. He L, He X, Lowe SW, Hannon GJ. microRNAs join the p53 network–another piece in the tumour-suppression puzzle. Nat Rev Cancer. 2007;7:819–822. - PMC - PubMed

Publication types

MeSH terms