

Pharmacy refill adherence compared with CD4 count changes for monitoring HIV-infected adults on antiretroviral therapy
- PMID: 18494555
- PMCID: PMC2386831
- DOI: 10.1371/journal.pmed.0050109
Pharmacy refill adherence compared with CD4 count changes for monitoring HIV-infected adults on antiretroviral therapy
Abstract
Background: World Health Organization (WHO) guidelines for monitoring HIV-infected individuals taking combination antiretroviral therapy (cART) in resource-limited settings recommend using CD4(+) T cell (CD4) count changes to monitor treatment effectiveness. In practice, however, falling CD4 counts are a consequence, rather than a cause, of virologic failure. Adherence lapses precede virologic failure and, unlike CD4 counts, data on adherence are immediately available to all clinics dispensing cART. However, the accuracy of adherence assessments for predicting future or detecting current virologic failure has not been determined. The goal of this study therefore was to determine the accuracy of adherence assessments for predicting and detecting virologic failure and to compare the accuracy of adherence-based monitoring approaches with approaches monitoring CD4 count changes.
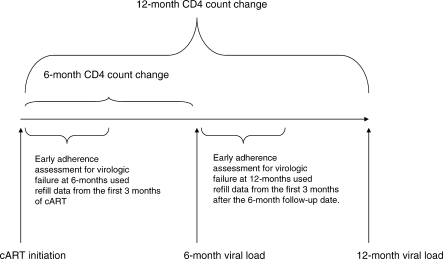
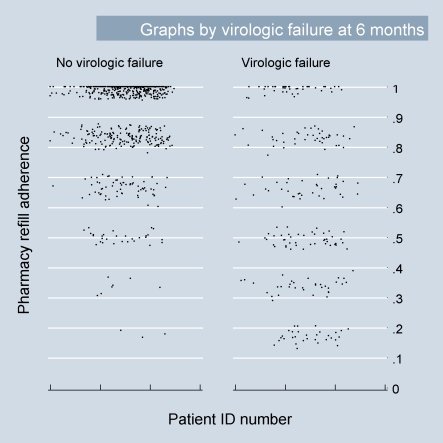
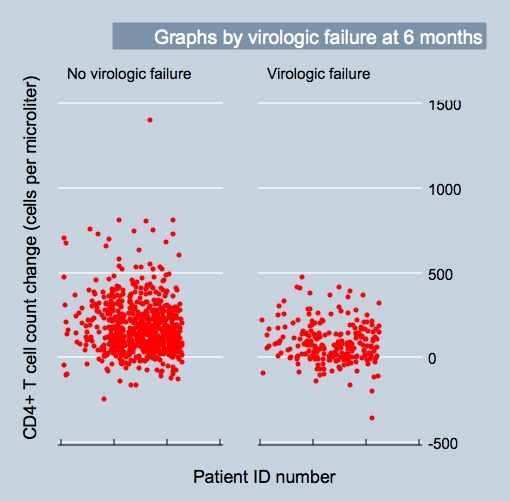
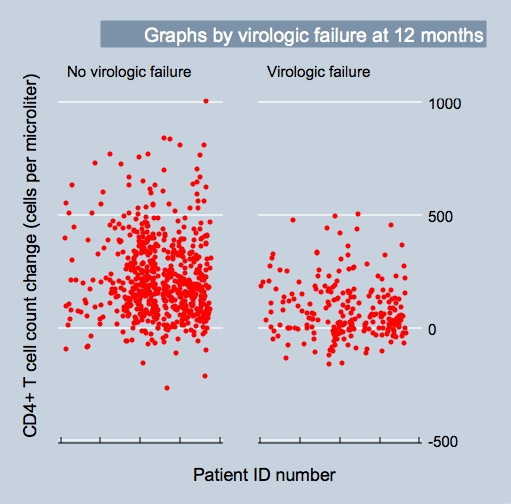
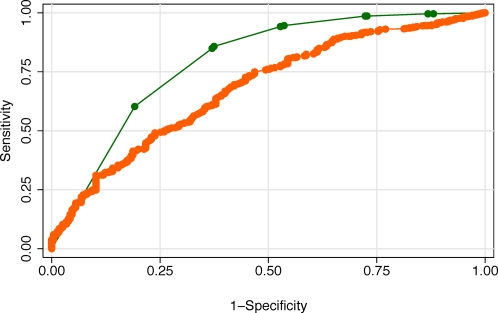
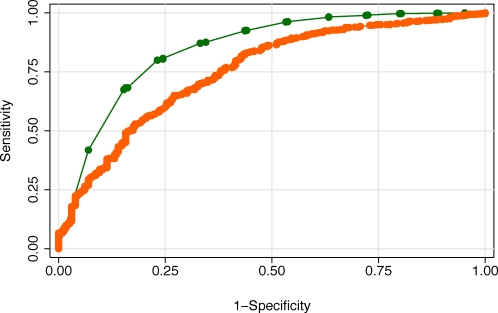
Methodology and findings: We conducted an observational cohort study among 1,982 of 4,984 (40%) HIV-infected adults initiating non-nucleoside reverse transcriptase inhibitor-based cART in the Aid for AIDS Disease Management Program, which serves nine countries in southern Africa. Pharmacy refill adherence was calculated as the number of months of cART claims submitted divided by the number of complete months between cART initiation and the last refill prior to the endpoint of interest, expressed as a percentage. The main outcome measure was virologic failure defined as a viral load > 1,000 copies/ml (1) at an initial assessment either 6 or 12 mo after cART initiation and (2) after a previous undetectable (i.e., < 400 copies/ml) viral load (breakthrough viremia). Adherence levels outperformed CD4 count changes when used to detect current virologic failure in the first year after cART initiation (area under the receiver operating characteristic [ROC] curves [AUC] were 0.79 and 0.68 [difference = 0.11; 95% CI 0.06 to 0.16; chi(2) = 20.1] respectively at 6 mo, and 0.85 and 0.75 [difference = 0.10; 95% CI 0.05 to 0.14; chi(2) = 20.2] respectively at 12 mo; p < 0.001 for both comparisons). When used to detect current breakthrough viremia, adherence and CD4 counts were equally accurate (AUCs of 0.68 versus 0.67, respectively [difference = 0.01; 95% CI -0.06 to 0.07]; chi(2) = 0.1, p > 0.5). In addition, adherence levels assessed 3 mo prior to viral load assessments were as accurate for virologic failure occurring approximately 3 mo later as were CD4 count changes calculated from cART initiation to the actual time of the viral load assessments, indicating the potential utility of adherence assessments for predicting future, rather than simply detecting current, virologic failure. Moreover, combinations of CD4 count and adherence data appeared useful in identifying patients at very low risk of virologic failure.
Conclusions: Pharmacy refill adherence assessments were as accurate as CD4 counts for detecting current virologic failure in this cohort of patients on cART and have the potential to predict virologic failure before it occurs. Approaches to cART scale-up in resource-limited settings should include an adherence-based monitoring approach.
Conflict of interest statement
Figures

Comment in
-
A paradigm shift to prevent HIV drug resistance.PLoS Med. 2008 May 20;5(5):e111. doi: 10.1371/journal.pmed.0050111. PLoS Med. 2008. PMID: 18494556 Free PMC article.
References
-
- [No author listed] Sources and Prices of Selected Medicines and Diagnostics for People Living with HIV/AIDS. World Health Organization, United Nations Children's Fund, Joint United Nations Programme on HIV/AIDS, Medecins Sans Frontieres; 2005.
-
- D'Aquila RT, Johnson VA, Welles SL, Japour AJ, Kuritzkes DR, et al. Zidovudine resistance and HIV-1 disease progression during antiretroviral therapy. AIDS Clinical Trials Group Protocol 116B/117 Team and the Virology Committee Resistance Working Group. Ann Intern Med. 1995;122:401–408. - PubMed
-
- Kozal MJ, Kroodsma K, Winters MA, Shafer RW, Efron B, et al. Didanosine resistance in HIV-infected patients switched from zidovudine to didanosine monotherapy. Ann Intern Med. 1994;121:263–268. - PubMed
-
- Zaccarelli M, Tozzi V, Lorenzini P, Trotta MP, Forbici F, et al. Multiple drug class-wide resistance associated with poorer survival after treatment failure in a cohort of HIV-infected patients. AIDS. 2005;19:1081–1089. - PubMed
-
- Hammer SM, Saag MS, Schechter M, Montaner JS, Schooley RT, et al. Treatment for adult HIV infection: 2006 recommendations of the International AIDS Society-USA panel. JAMA. 2006;296:827–843. - PubMed
Publication types
MeSH terms
Substances
Grants and funding
- U01-AI32783/AI/NIAID NIH HHS/United States
- HS10399/HS/AHRQ HHS/United States
- P30-AI45008/AI/NIAID NIH HHS/United States
- K08MH01584/MH/NIMH NIH HHS/United States
- K23AI058881/AI/NIAID NIH HHS/United States
- K23AI068582-01/AI/NIAID NIH HHS/United States
- P30 AI045008/AI/NIAID NIH HHS/United States
- K23 AI058881/AI/NIAID NIH HHS/United States
- K08 MH001584/MH/NIMH NIH HHS/United States
- K23 AI068582/AI/NIAID NIH HHS/United States
- U18 HS010399/HS/AHRQ HHS/United States
- U01 AI032783/AI/NIAID NIH HHS/United States
LinkOut - more resources
Full Text Sources
Medical
Research Materials
