. 2008 Jun 26;154(3):953-64.
doi: 10.1016/j.neuroscience.2008.04.022. Epub 2008 May 20.

Dendritic A-type potassium channel subunit expression in CA1 hippocampal interneurons

Affiliations

Dendritic A-type potassium channel subunit expression in CA1 hippocampal interneurons

M Menegola et al. Neuroscience. .

Abstract

Voltage-gated potassium (Kv) channels are important and diverse determinants of neuronal excitability and exhibit specific expression patterns throughout the brain. Among Kv channels, Kv4 channels are major determinants of somatodendritic A-type current and are essential in controlling the amplitude of backpropagating action potentials (BAPs) into neuronal dendrites. BAPs have been well studied in a variety of neurons, and have been recently described in hippocampal and cortical interneurons, a heterogeneous population of GABAergic inhibitory cells that regulate activity of principal cells and neuronal networks. We used well-characterized mouse monoclonal antibodies against the Kv4.3 and potassium channel interacting protein (KChIP) 1 subunits of A-type Kv channels, and antibodies against different interneuron markers in single- and double-label immunohistochemistry experiments to analyze the expression patterns of Kv4.3 and KChIP1 in hippocampal Ammon's horn (CA1) neurons. Immunohistochemistry was performed on 40 mum rat brain sections using nickel-enhanced diaminobenzidine staining or multiple-label immunofluorescence. Our results show that Kv4.3 and KChIP1 component subunits of A-type channels are co-localized in the soma and dendrites of a large number of GABAergic hippocampal interneurons. These subunits co-localize extensively but not completely with markers defining the four major interneuron subpopulations tested (parvalbumin, calbindin, calretinin, and somatostatin). These results suggest that CA1 hippocampal interneurons can be divided in two groups according to the expression of Kv4.3/KChIP1 channel subunits. Antibodies against Kv4.3 and KChIP1 represent an important new tool for identifying a subpopulation of hippocampal interneurons with a unique dendritic A-type channel complement and ability to control BAPs.


Figures

Fig. 1
Fig. 1
Kv4.3 and KChIP1 are colocalized in the CA1 subfield of the hippocampus. (A-B) immunoperoxidase staining of 40 μm sagittal rat hippocampal sections with anti-Kv4.3 (A; K75/30) and anti-KChIP1 (B; K55/7) monoclonal antibodies. The staining pattern of these A-type channel subunits in the CA1 subfield of hippocampus is similar and is localized in the soma and dendrites of a large group of heterogeneous cells scattered in all layers. Scale bar 200 μm. (C-E) double-label immunofluorescence staining of the CA1 subfield of hippocampus with anti-KChIP1 (E, green in C; K55/29) and anti-Kv4.3 (D, red in C; K75/41) monoclonal antibodies. The two subunits are virtually completely colocalized with only few cells presenting preferential immunofluorescence staining for one or the other subunit. Scale bar = 100 μm. (F-J) Higher magnification images showing the overlap of Kv4.3 (middle panels and red in top panels) and KChIP1 (bottom panels and green in top panels). Kv4.3 is associated with the plasma membrane and KChIP1 with the plasma membrane and cytoplasm. The majority of the cells exhibited comparable immunofluorescence signals for both subunits (F). A small subset of cells exhibited preferential staining for either Kv4.3 or KChIP1 (G-J), including a small number of neurons with very weak KChIP1 staining (upper cell in I, cell on left in J). Scale bar = 20 μm.
Fig. 2
Fig. 2
Kv4.3 and KChIP1 are localized in the somata and dendrites of CA1 GABAergic interneurons. (A) double-label immunostaining with anti-Kv4.3 (middle panel, red in left panel; K75/41) and pan-axonal (right panel, green in left panel) monoclonal antibodies. No colocalization was observed indicating the absence of axonal localization of Kv4.3. (B) double-label immunostaining with anti-KChIP1 (middle panel, red in left panel; K55/29) and anti-MAP2 (right panel, green in left panel) monoclonal antibodies. The staining was colocalized in KChIP1-positive cells confirming the somatodendritic distribution of KChIP1. (C-D) double-label immunostaining with mouse anti-KChIP1 (K55/7; middle panels, red in left panels) and rabbit anti-GABA (right panels, green in left panels) antibodies in strata pyramidale (C) and lacunosum-moleculare (D) of CA1. Note that ≈30% of KChIP1-positive cells presented very weak GABA immunostaining, often possible to visualize only at higher magnification with the use of a confocal microscope as in the cell on the left in D. Scale bar = 20 μm.
Fig. 3
Fig. 3
Expression of KChIP1 in the CA1 interneuron subpopulation expressing PV. (A-C) double-label immunofluorescence staining of the CA1 region of rat hippocampus with anti-KChIP1 (B, red in A; K55/29) and anti-PV (C, green in A) monoclonal antibodies. Scale bar = 100 μm. (D) percentage of the PV-positive subpopulation also positive for KChIP1 (*= no PV-positive cells or only very few were present in the strata radiatum and lacunosum-moleculare). (E) percentage of the KChIP1-positive subpopulation also positive for PV. (F-I) higher magnification views of cells presenting overlapping PV (bottom panels and green in top panel) and KChIP1 (middle panels and red in top panel) staining in the strata pyramidale (F-H) and in the stratum oriens-alveus (I). In panels H and I cells immunoreactive exclusively for KChIP1 are also observed. Scale bar = 20 μm.
Fig. 4
Fig. 4
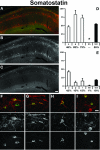
Expression of KChIP1 in the CA1 interneuron subpopulation expressing SO. (A-C) double-label immunofluorescence staining with anti-KChIP1 (B, red in A; K55/29) and anti-SO (C, green in A) monoclonal antibodies. Scale bar = 100 μm. (D) percentage of the SO-positive subpopulation also positive for KChIP1. (*=in the stratum lacunosum-moleculare no cells or only very few were SO-positive). (E) percentage of the KChIP1-positive subpopulation also positive for SO. F-I: higher magnification views of cells exhibiting overlapping SO (bottom panels and green in top panels) and KChIP1 (middle panels and red in top panels) staining in the strata oriens-alveus (F-G) and pyramidale (H), and at the border between strata pyramidale and oriens (I). In F a cell staining exclusively for SO is present, while in G and I cells staining exclusively for KChIP1 are present. Scale bar = 20 μm.
Fig. 5
Fig. 5
Expression of KChIP1 in the CA1 interneuron subpopulation expressing CB. (A-C) double-label immunofluorescence staining with mouse anti-KChIP1 (B, red in A; K55/7) and rabbit anti-CB (C, green in A) antibodies. Scale bar = 100 μm. (D) percentage of the CB-positive subpopulation also positive for KChIP1. (E) percentage of the KChIP1-positive subpopulation also positive for CB. (F-I) higher magnification views of cells exhibiting overlapping CB (bottom panels and green in top panels) and KChIP1 (middle panels and red in top panels) staining in the at the border between strata pyramidale and oriens (F) and in strata lacunosum-moleculare (G) oriens-alveus (H) and radiatum (I). Scale bar 20 μm.
Fig. 6
Fig. 6
Expression of KChIP1 in the CA1 interneuron subpopulation expressing CR. (A-C) double-label immunofluorescence staining with mouse anti-KChIP1 (B, red in A; K55/7) and rabbit anti-CR (C, green in A) antibodies. Scale bar = 100 μm. (D) percentage of the CR-positive subpopulation also positive for KChIP1. (E) percentage of the KChIP1-positive subpopulation also positive for CR. (F-I) higher magnification views of cells exhibiting overlapping CB (bottom panels and green in top panels) and KChIP1 (middle panels and red in top panels) staining in the strata pyramidale (F-H) and lacunosum-moleculare (I). The cells presenting both KChIP1 and CR staining were mostly weakly positive for CR in contrast with cells only positive for CR (H). Scale bar = 20 μm.

References

    1. An WF, Bowlby MR, Betty M, Cao J, Ling HP, Mendoza G, Hinson JW, Mattsson KI, Strassle BW, Trimmer JS, Rhodes KJ. Modulation of A-type potassium channels by a family of calcium sensors. Nature. 2000;403:553–556. - PubMed
    1. Baimbridge KG, Miller JJ, Parkes CO. Calcium-binding protein distribution in the rat brain. Brain Res. 1982;239:519–525. - PubMed
    1. Bekkers JM. Distribution and activation of voltage-gated potassium channels in cell-attached and outside-out patches from large layer 5 cortical pyramidal neurons of the rat. J Physiol. 2000;525:611–620. - PMC - PubMed
    1. Bischofberger J, Jonas P. Action potential propagation into the presynaptic dendrites of rat mitral cells. J Physiol. 1997;504(Pt 2):359–365. - PMC - PubMed
    1. Bourdeau ML, Morin F, Laurent CE, Azzi M, Lacaille JC. Kv4.3-mediated A-type K+ currents underlie rhythmic activity in hippocampal interneurons. J Neurosci. 2007;27:1942–1953. - PMC - PubMed

Publication types

MeSH terms