. 2008 Aug;20(8):1459-70.
doi: 10.1016/j.cellsig.2008.04.002. Epub 2008 Apr 15.

The cAMP-activated GTP exchange factor, Epac1 upregulates plasma membrane and nuclear Akt kinase activities in 8-CPT-2-O-Me-cAMP-stimulated macrophages: Gene silencing of the cAMP-activated GTP exchange Epac1 prevents 8-CPT-2-O-Me-cAMP activation of Akt activity in macrophages

Affiliations

The cAMP-activated GTP exchange factor, Epac1 upregulates plasma membrane and nuclear Akt kinase activities in 8-CPT-2-O-Me-cAMP-stimulated macrophages: Gene silencing of the cAMP-activated GTP exchange Epac1 prevents 8-CPT-2-O-Me-cAMP activation of Akt activity in macrophages

Uma K Misra et al. Cell Signal. 2008 Aug.

Abstract

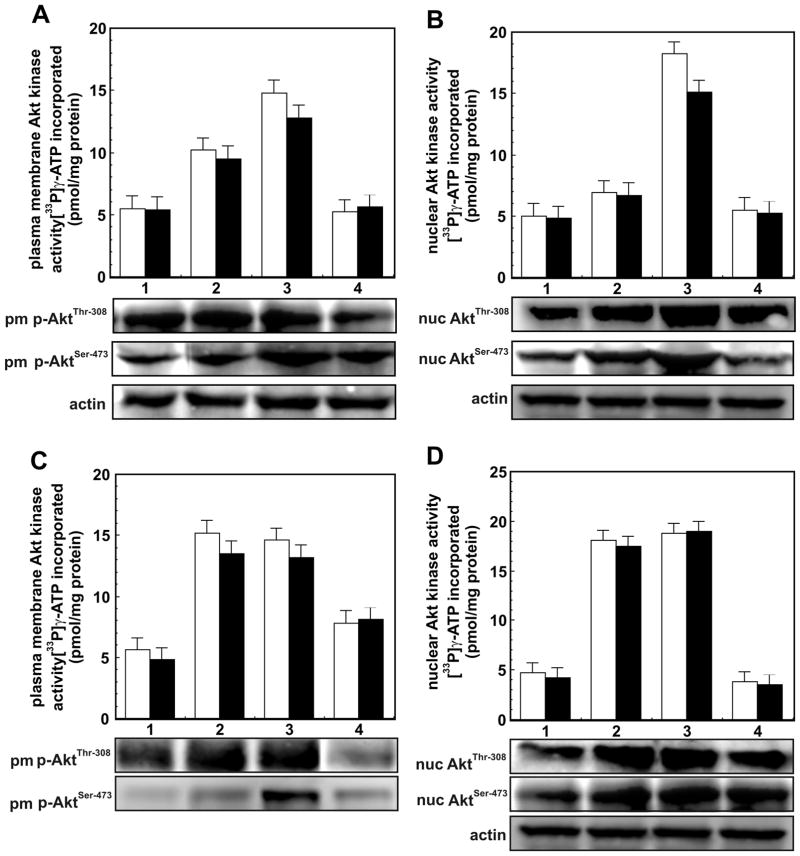
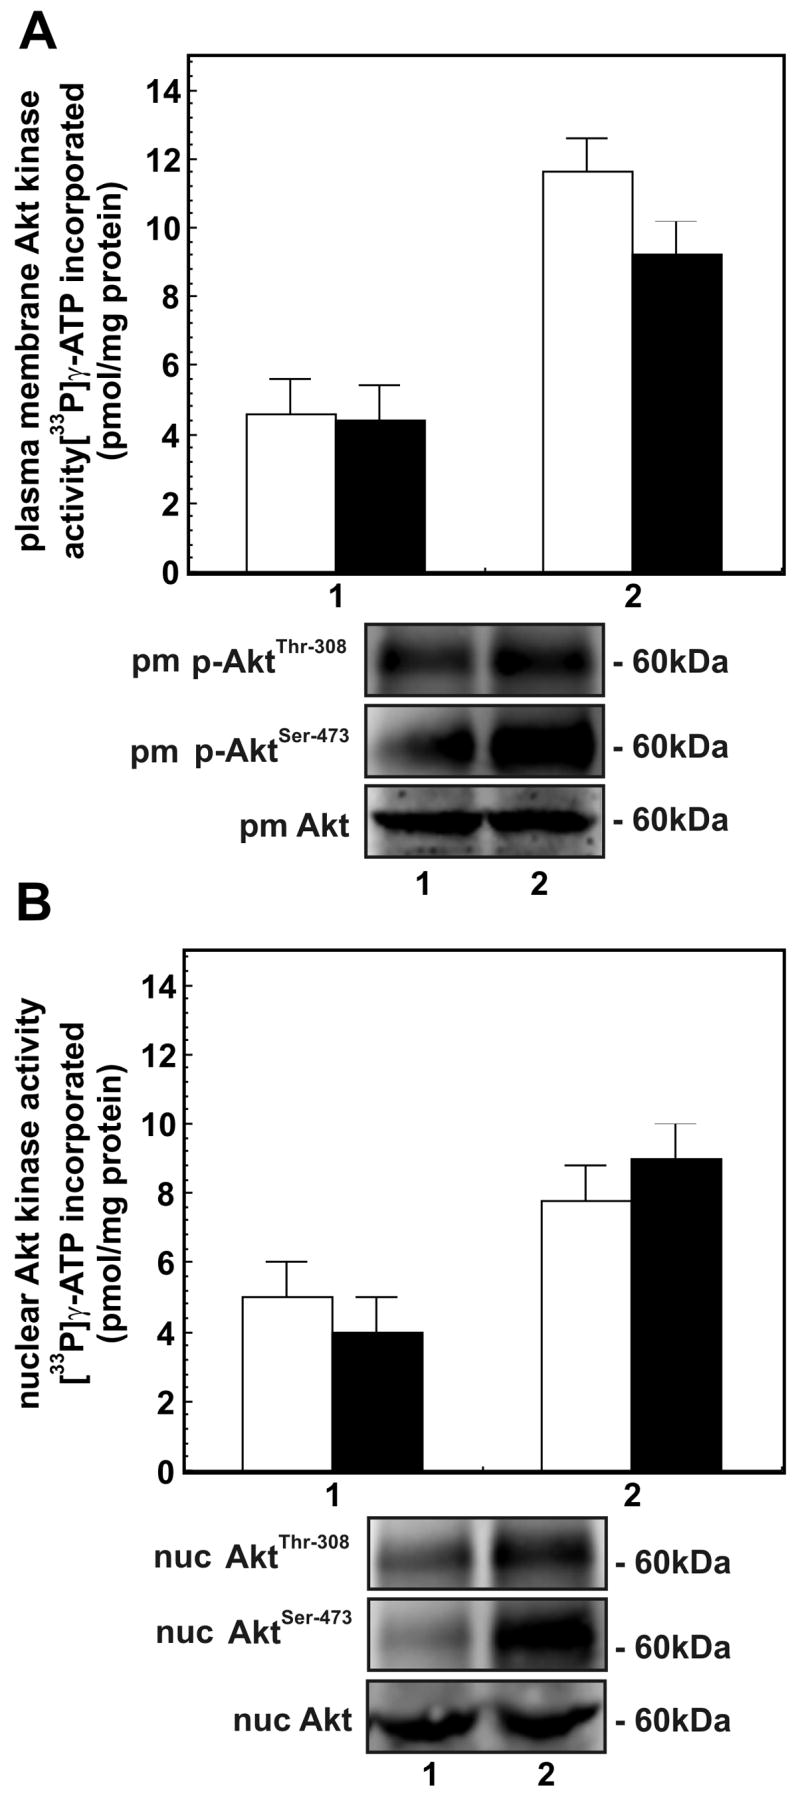
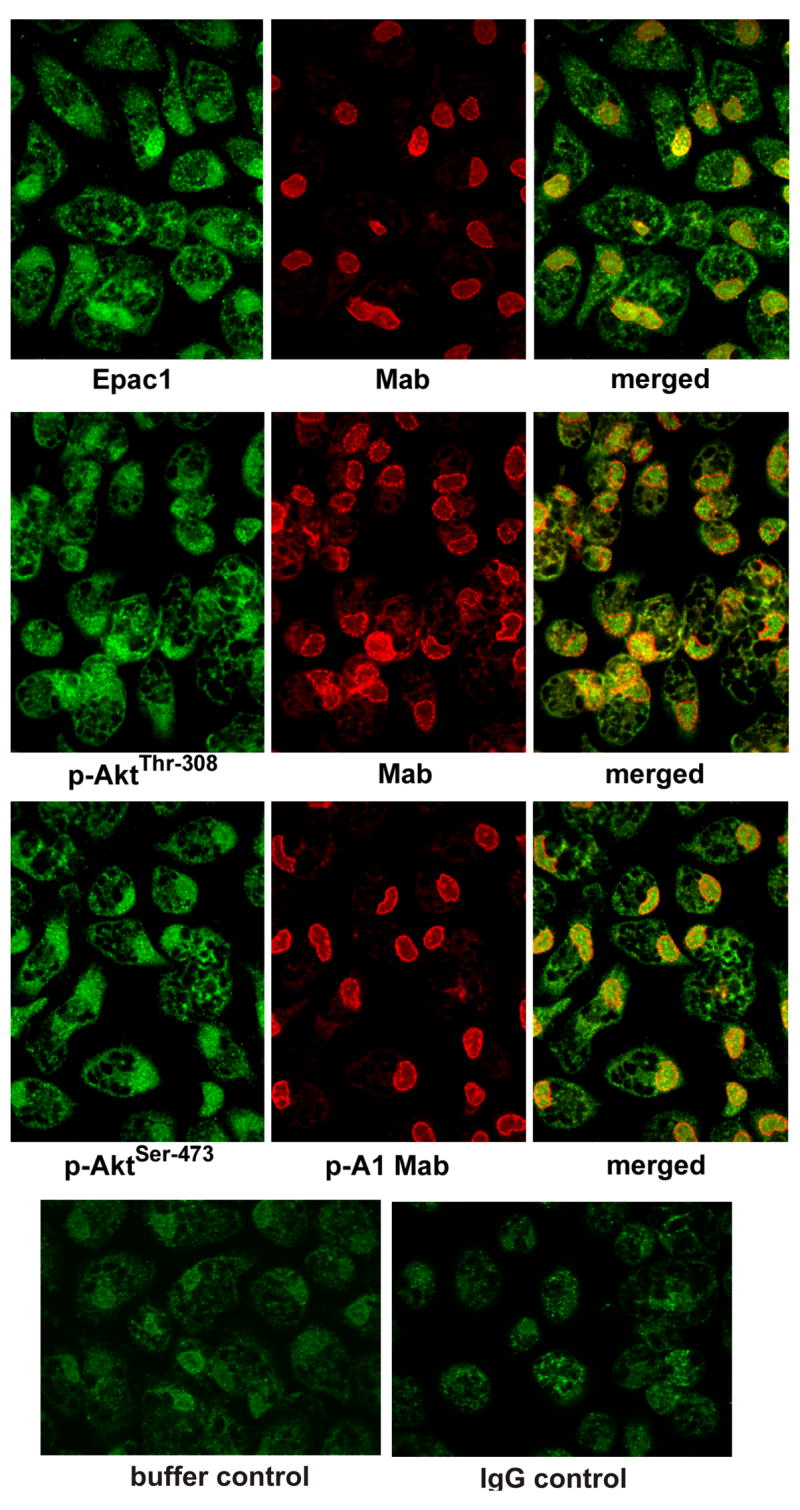
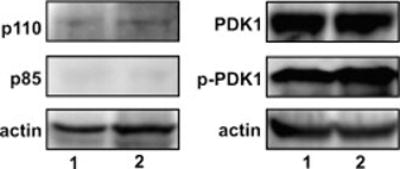
cAMP regulates a wide range of processes through its downstream effectors including PKA, and the family of guanine nucleotide exchange factors. Depending on the cell type, cAMP inhibits or stimulates growth and proliferation in a PKA-dependent or independent manner. PKA-independent effects are mediated by PI 3-kinases-Akt signaling and EPAC1 (exchange protein directly activated by cAMP) activation. Recently, we reported PKA-independent activation of the protein kinase Akt as well co-immunoprecipitation of Epac1 with Rap1, p-Akt(Thr-308), and p-Akt(Ser-473) in forskolin-stimulated macrophages. To further probe the role of Epac1 in Akt protein kinase activation and cellular proliferation, we employed the cAMP analog 8-CPT-2-O-Me-cAMP, which selectively binds to Epac1 and triggers Epac1 signaling. We show the association of Epac1 with activated Akt kinases by co-immunoprecipitation and GST-pulldown assays. Silencing Epac1 gene expression by RNA interference significantly reduced levels of Epac1 mRNA, Epac protein, Rap1 GTP, p-ERK1/2, p-B-Raf, p110alpha catalytic subunit of PI 3-kinase, p-PDK, and p-p(70s6k). Silencing Epac1 gene expression by RNA interference also suppressed 8-CPT-2-O-Me-cAMP-upregulated protein and DNA synthesis. Concomitantly, 8-CPT-2-O-Me-cAMP-mediated upregulation of Akt(Thr-308) protein kinase activity and p-Akt(Thr-308) levels was prevented in plasma membranes and nuclei of the cells. In contrast, silencing Epac1 gene expression reduced Akt(Ser-473) kinase activity and p-Akt(Ser-473) levels in plasma membranes, but showed negligible effects on nuclear activity. In conclusion, we show that cAMP-induced Akt kinase activation and cellular proliferation is mediated by Epac1 which appears to function as an accessory protein for Akt activation.


Figures

Figure 1
Figure 1. AktThr-308 and AktSer-473 kinase activities immunoprecipitated with Akt1 in plasma membrane and nuclei of macrophages
Panel A - AktThr-308 and AktSer-473 kinase activities in plasma membranes of macrophages treated with: (1) buffer; (2) forskolin (10 μM/10 min); (3) 8-CPT-O-Me-cAMP (200 μM/30 min) and (4) 6Benz-cAMP (200 μM/30). The bars are: [□] AktThr-308 kinase activity and [■] AktSer-473 kinase activity. Panel B. AktThr-308 and AktSer-473 kinase activities in nuclei of cells treated as in Panel A. The bars are: [□] AktThr-308 kinase activity and [■] AktSer-473 kinase activity. Both Akt kinase activities in Akt immunoprecipitates of plasma membrane and nuclei are expressed as pmol [33P]γ-ATP incorporated into respective peptides/mg protein and are mean ± SE from four independent experiments done in duplicates. The immunoblots showing changes in protein levels of p-AktThr-308and p-AktSer-473 in plasma membranes and nuclei of cells treated as in Panel A are shown below respective panels. Immunoblot of protein loading control actin is also shown. Panel C - Effect of PKA inhibitor H-89 and PI 3-kinase inhibitor LY294002 on 8-CPT-2-O-Me-cAMP-induced increase in AktThr-308 and AktSer-473 kinase activities in plasma membrane of macrophage treated with: (1) buffer; (2) 8-CPT-2-O-Me-cAMP (200 μM/30 min); (3) H-89 (10 μm/90 min) then 8-CPT-2-O-Me-cAMP, and (4) PI 3-kinase inhibitor LY294002 (20 μm/20 min) then 8-CPT-2-O-Me-cAMP. Panel D. Effect of H-89 and LY294002 on 8-CPT-2-O-Me-cAMP-stimulated AktThr-308 and AktSer-473 kinase activities in nuclei of macrophages treated as in Panel C. The bars are: [□] AktThr-308 kinase and [■] AktSer-473 kinase. The activities of both kinases in plasma membranes and nuclei in Panel C and D are expressed as in Panel A and B. The immunoblots showing changes in the levels of p-AktThr-308 and p-AktSer-473 in plasma membrane and nuclei of cells treated as in Panel C are shown below respective panels. Protein loading control actin is also shown.
Figure 2
Figure 2. AktThr-308 and AktSer-473 kinase activities in Epac1 immunoprecipitate of plasma membrane and nuclei of macrophages
Panel A - AktThr-308 and AktSer-473 kinase activities in plasma membranes of macrophages treated with: (1) buffer; and (2) 8-CPT-2-O-Me-cAMP (200 μM/30 min). The bars are: [□] AktThr-308 kinase activity and [■] AktSer-473 kinase activity. Panel B - AktThr-308 and AktSer-473 kinase activites in nuclei of cells treated as in Panel A. The bars are: [□] AktThr-308 kinase activity and [■] AktSer-473 kinase activity. Both Akt kinases activities in Epac1 immunoprecipitates of plasma membranes and nuclei are expressed as pmol [33P]γ-ATP incorporated into respective peptides/mg protein and are mean ± SE from three independent experiments. The immunoblots showing changes in levels of p-AtkThr-308 and p-AktSer-473 in plasma membranes and nuclei of cells treated as in Panel A are shown below respective panels. Immunoblot of protein loading control Akt is also shown.
Figure 3
Figure 3. Activation of Rap1 in cells treated with 8-CPT-2-O-Me-cAMP
Panel A. Immunoblots showing the presence of Epac1 protein in plasma membrane and nuclear fractions of cells treated with: (1) buffer and (2) 8-CPT-2-O-Me-cAMP (200 μM/30 min). The changes in Epac1 protein levels in plasma membranes and nuclei of macrophages stimulated with: (1) buffer or (2) 8-CPT-2-O-Me-cAMP are shown as a bar diagram above the respective immunoblots and are expressed in arbitrary units × 103 and are expressed as the mean ± SE from triplicate studies. Panel B. Epac1-induced activation of Rap1 in plasma membrane and nuclear fractions of cells. The lanes in immunoblots are: (1) RAP1•GTP in buffer-treated cells; (2) Rap1•GTP levels in 8-CPT-O-Me-cAMP-stimulated cells, and (3) total RAP1 protein levels in 8-CPT-O-2-Me-cAMP-stimulated cells. Immunoblots shown are representative of at least three experiments. Only one gel of the protein loading control, actin, is shown though these were performed in each case. Molecular weights of phosphorylated Akt1 are shown in kDa. Molecular weights of Epac1 and Rap1 in kDa are also shown. The changes in RAP1•GTP protein levels in plasma membranes and nuclei of macrophages stimulated with: (1) buffer or (2) 8-CPT-2-O-Me-cAMP and (3) total Rap1 protein levels in 8-CPT-2-O-Me-cAMP-stimulated cells are shown above the respective immunoblot as a bar diagram in arbitrary units × 103 and is expressed as the mean ± SE from triplicate experiments. Panel C. Immunoblot showing suppression of Rap1 activation upon down regulation of Epac1 gene expression by RNAi. The lanes are: (1) lipofectamine + buffer, (2) lipofectamine + 8 CPT-2-O-Me-cAMP (200 μm/30 min) and (4) scrambled dsRNA + 8-CPT-2-O-Me-cAMP. The immunoblot shown is representative of two experiments. The changes in Rap1•GTP protein levels in macrophages treated with: (1) lipofectamine + buffer; (2) lipofectamine + 8-CPT-2-O-Me-cAMP (200 μg/30 min); (3) Epac1 dsRNA + 8-CPT-2-O-Me-cAMP: and (4) scrambled dsRNA + 8-CPT-2-O-Me-cAMP are shown above the respective immunoblot as a bar diagram in arbitrary units × 104 and is expressed as the mean ± SE from duplicate experiments performed in duplicate.
Figure 4
Figure 4. 125I-GST Epac1-gluthathione-Sepharose-4B pulldown assay showing association of Epac1, and Akt1, in 8-CPT-2-O-Me-cAMP-stimulated cells
Panel A. Autoradiograph showing the presence of 125I-Epac1 in membranes immunoblotted with anti-Epac1 and anti-Akt1 antibodies respectively. The lanes are: (1) cell lysates from buffer-treated cells incubated with 125I-labeled GST Epac1-glutathione-Sepharose-4B beads; (2) cell lysates from 8-CPT-2-O-Me-cAMP-treated cells incubated with 125I-labeled GST-Epac1-glutathione-Sepharose-4B beads; (3) Akt1 protein incubated with 125I-labeled GST-Epac1 absorbed on glutathione-Sepharose-4B beads. 125I-GST-Epac1 protein standard (S) is also shown in Epac1 autoradiograph. Panel B. Changes in protein levels of Epac1 (□) and Akt1 (■) are shown in bar diagram below by immunoblot. Changes are expressed in arbitrary units and are ± SE from two experiments done independent. Immunoblots of autoradiographs of Panel A showing physical association of Akt with Epac1. Protein standards of Epac1, Akt1(s) are also shown in the respective immunoblots. Other details are as in Panel A. The autoradiograph and immunoblots shown are representative of two experiments.
Figure 5
Figure 5. Subcellular localization of Epac1 p-Akt1Thr-308 and p-AktSer-473 in cells treated with 8-CPT-2-O-Me-cAMP as determined by confocal microscopy
See “Experimental Procedures” for details. The localization of Epac1, p-AktThr-308, and p-AktSer-473 (green) in the perinuclear nuclear region stimulated cells compared to unstimulated cells was determined using a nuclear marker Mab414 (red). Perinuclear localization of Epac1, p-AktThr-308, and p-AktSer-473 in stimulated cells is seen on merging of green and red fluorescence. The results shown are representative of six independent experiments.
Figure 6
Figure 6. Effect of transfection with Epac1 dsRNA on Epac1 protein and mRNA levels in cells stimulated with 8-CPT-2-O-Me-cAMP
Panel A. Epac1 protein levels in cells treated with (1) lipofectamine + buffer; (2) lipofectamine + 8-CPT-2-O-Me-cAMP; (3) Epac dsRNA (20 nmol) + 8-CPT-2-O-Me-cAMP, (4) lipofectamine + scrambled dsRNA + 8-CPT-2-O-Me-cAMP. The protein loading control actin immunoblot is also shown. See Experimental Procedures for details. Immunoblots shown are representative of two independent experiments. The changes in Epac1 protein levels in macrophages stimulated with (1) lipofectamine + buffer; (2) lipofectamine + 8-CPT-2-O-Me-cAMP (200 μM/30 min); (3) Epac1 dsRNA + 8-CPT-2-O-Me-cAMP; and (4) scrambled dsRNA + 8-CPT-O-Me-cAMP are shown as the ratio of protein/actin in a bar diagram above the immunoblot. The ratios are the mean ±SE from duplicate experiments performed in duplicate. Panel B. Epac1 mRNA levels in cells treated as in Panel A. The changes in Epac mRNA levels in cells treated as in Panel A are shown as the ratio of Epac1 mRNA/β-actin in the bar diagram. The ratios are the mean ± SE from two experiments in duplicate.
Figure 7
Figure 7. Immunoblots of nuclear lysates of macrophages stimulated with 8-CPT-2-O-Me-cAMP showing negligible presence of catalytic and regulatory subunits of PI 3-kinase
The lanes in immunoblots are: (1) buffer; and (2) 8-CPT-2-O-Me-cAMP (200μM/30 m). Immunoblots shown are representative of at least three experimentss. Protein loading control actin is also shown.
Figure 8
Figure 8. Effects of silencing macrophage Epac1 gene expression on 8-CPT-2-O-Me-cAMP-dependent events
Panel A. Suppression of 8-CPT-2-O-Me-cAMP-upregulated protein synthesis in macrophages upon down regulation of Epac1 gene expression by RNAi. Protein synthesis is measured by cellular [3H]leucine uptake and is expressed as the mean ± SE from triplicate experiments. The data are expressed as pmol [3H]leucine incorporated mg protein. The bars are: (1) lipofectamine + buffer; (2) lipofectamine + 8-CPT-2-O-Me-cAMP (200 μM/30 min/37°C); (3) Epac1 dsRNA + 8-CPT-2-O-Me-cAMP; and (4) scrambled dsRNA + 8-CPT-2-O-Me-cAMP. Panel B. Silencing Epac1 gene expression inhibits 8-CPT-2-O-Me-cAMP induced DNA synthesis. DNA synthesis is measured as [3H]thymidine uptake and is expressed as the mean ±SE from triplicate experiments (pmol/mg protein). The bars are as in Panel A. Panel C. Down regulation of the Epac1 gene expression by RNAi causes inhibition of ERK1/2 (□) and B-Raf (■) activation. The immunoblot shown is represenative of two experiments. The lanes are: (1) lipofectamine + buffer; (2) lipofectamine + 8-CPT-2-O-Me-cAMP (200μM/30 min/30°C); and (3) Epac1 dsRNA + 8-CPT-2-O-Me-cAMP. The protein loading controls unphosphorylated ERK1/2 and B-Raf are also shown below the respective immunoblots. The changes in phospho-ERK1/2 and phospho-B-Raf are expressed as ratios of phosphorylated/unphosphorylated kinases and are shown as a bar diagram above the immunoblot. Panel D. Effect of silencing Epac1 gene expression on 8-CPT-2-O-Me-cAMP-induced upregulated protein levels of the p110α catalytic subunit of PI 3-kinase; phosphorylated-PDK1, and phosphorylated-p70s6k. Changes in protein levels of p-PDK1 and p-p70s6k are shown as ratios of protein/actin in a bar diagram above the immunoblot as in Panel C. In preliminary experiments transfection of cells with scrambled dsRNA showed negligible or little effect on various kinase proteins. Therefore, these controls were not performed in these experiments.

Similar articles

Cited by

References

    1. Datta SR, Brunet A, Greenberg MA. Genes Dev. 1999;13:2905–2927. - PubMed
    1. Brazil DP, Yang ZZ, Hemmings BA. Trends Biochem Sci. 2004;29:233–242. - PubMed
    1. Bellacosa A, Kumar cC, DiCristofano AD, Testa JR. Adv Cancer Res. 2005;94:29–86. - PubMed
    1. Woodgett JR. Curr Opin Cell Biol. 2005;17:150–157. - PubMed
    1. Du K, Tsichlis PN. Oncogene. 2005;24:7401–7409. - PubMed

MeSH terms

Substances