

SCUMBLE: a method for systematic and accurate detection of codon usage bias by maximum likelihood estimation
- PMID: 18495752
- PMCID: PMC2441815
- DOI: 10.1093/nar/gkn288
SCUMBLE: a method for systematic and accurate detection of codon usage bias by maximum likelihood estimation
Abstract
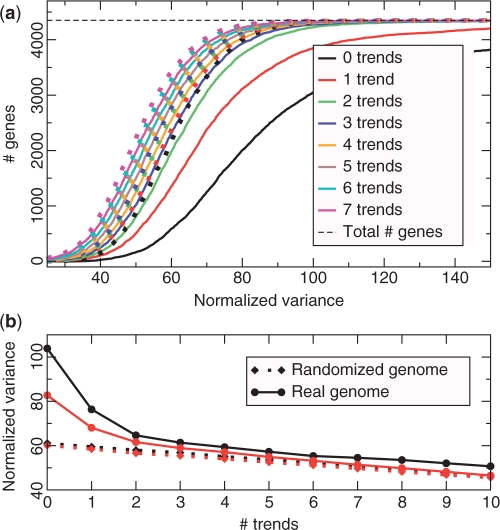
The genetic code is degenerate--most amino acids can be encoded by from two to as many as six different codons. The synonymous codons are not used with equal frequency: not only are some codons favored over others, but also their usage can vary significantly from species to species and between different genes in the same organism. Known causes of codon bias include differences in mutation rates as well as selection pressure related to the expression level of a gene, but the standard analysis methods can account for only a fraction of the observed codon usage variation. We here introduce an explicit model of codon usage bias, inspired by statistical physics. Combining this model with a maximum likelihood approach, we are able to clearly identify different sources of bias in various genomes. We have applied the algorithm to Saccharomyces cerevisiae as well as 325 prokaryote genomes, and in most cases our model explains essentially all observed variance.
Figures
Similar articles
-
Quantification of codon selection for comparative bacterial genomics.BMC Genomics. 2011 Jul 25;12:374. doi: 10.1186/1471-2164-12-374. BMC Genomics. 2011. PMID: 21787402 Free PMC article.
-
Codon Usage Optimization in the Prokaryotic Tree of Life: How Synonymous Codons Are Differentially Selected in Sequence Domains with Different Expression Levels and Degrees of Conservation.mBio. 2020 Jul 21;11(4):e00766-20. doi: 10.1128/mBio.00766-20. mBio. 2020. PMID: 32694138 Free PMC article.
-
Hidden patterns of codon usage bias across kingdoms.J R Soc Interface. 2020 Feb;17(163):20190819. doi: 10.1098/rsif.2019.0819. Epub 2020 Feb 19. J R Soc Interface. 2020. PMID: 32070219 Free PMC article.
-
The Yin and Yang of codon usage.Hum Mol Genet. 2016 Oct 1;25(R2):R77-R85. doi: 10.1093/hmg/ddw207. Epub 2016 Jun 27. Hum Mol Genet. 2016. PMID: 27354349 Free PMC article. Review.
-
Codon usage patterns in Escherichia coli, Bacillus subtilis, Saccharomyces cerevisiae, Schizosaccharomyces pombe, Drosophila melanogaster and Homo sapiens; a review of the considerable within-species diversity.Nucleic Acids Res. 1988 Sep 12;16(17):8207-11. doi: 10.1093/nar/16.17.8207. Nucleic Acids Res. 1988. PMID: 3138659 Free PMC article. Review.
Cited by
-
Genome-wide patterns of codon bias are shaped by natural selection in the purple sea urchin, Strongylocentrotus purpuratus.G3 (Bethesda). 2013 Jul 8;3(7):1069-83. doi: 10.1534/g3.113.005769. G3 (Bethesda). 2013. PMID: 23637123 Free PMC article.
-
Variations in Helicobacter pylori cytotoxin-associated genes and their influence in progression to gastric cancer: implications for prevention.PLoS One. 2012;7(1):e29605. doi: 10.1371/journal.pone.0029605. Epub 2012 Jan 3. PLoS One. 2012. PMID: 22235308 Free PMC article.
-
Genes optimized by evolution for accurate and fast translation encode in Archaea and Bacteria a broad and characteristic spectrum of protein functions.BMC Genomics. 2010 Nov 4;11:617. doi: 10.1186/1471-2164-11-617. BMC Genomics. 2010. PMID: 21050470 Free PMC article.
-
Characterizing the native codon usages of a genome: an axis projection approach.Mol Biol Evol. 2011 Jan;28(1):211-21. doi: 10.1093/molbev/msq185. Epub 2010 Aug 2. Mol Biol Evol. 2011. PMID: 20679093 Free PMC article.
-
Forces that influence the evolution of codon bias.Philos Trans R Soc Lond B Biol Sci. 2010 Apr 27;365(1544):1203-12. doi: 10.1098/rstb.2009.0305. Philos Trans R Soc Lond B Biol Sci. 2010. PMID: 20308095 Free PMC article. Review.
References
-
- Ikemura T. Correlation between the abundance of Escherichia coli transfer RNAs and the occurrence of the respective codons in its protein genes. J. Mol. Biol. 1981;146:1–21. - PubMed
-
- Ikemura T. Correlation between the abundance of Escherichia coli transfer RNAs and the occurrence of the respective codons in its protein genes: a proposal for a synonymous codon choice that is optimal for the E. coli translational system. J. Mol. Biol. 1981;151:389–409. - PubMed
-
- Bennetzen JL, Hall BD. Codon selection in yeast. J. Biol. Chem. 1982;257:3026–3031. - PubMed
-
- Ikemura T. Correlation between the abundance of yeast transfer RNAs and the occurrence of the respective codons in its protein genes: differences in synonymous codon choice patterns of yeast and Escherichia coli with reference to the abundance of isoaccepting transfer RNAs. J. Mol. Biol. 1982;158:573–597. - PubMed
-
- Bibb MJ, Findlay PR, Johnson MW. The relationship between base composition and codon usage in bacterial genes and its use for simple and reliable identification of protein-coding sequences. Gene. 1984;30:157–166. - PubMed
Publication types
MeSH terms
Substances
LinkOut - more resources
Full Text Sources
Molecular Biology Databases
