. 2008 Aug;19(8):3369-78.
doi: 10.1091/mbc.e08-03-0322. Epub 2008 May 21.

Aquaporin-4 dynamics in orthogonal arrays in live cells visualized by quantum dot single particle tracking

Affiliations

Aquaporin-4 dynamics in orthogonal arrays in live cells visualized by quantum dot single particle tracking

Jonathan M Crane et al. Mol Biol Cell. 2008 Aug.

Abstract

Freeze-fracture electron microscopy (FFEM) indicates that aquaporin-4 (AQP4) water channels can assemble in cell plasma membranes in orthogonal arrays of particles (OAPs). We investigated the determinants and dynamics of AQP4 assembly in OAPs by tracking single AQP4 molecules labeled with quantum dots at an engineered external epitope. In several transfected cell types, including primary astrocyte cultures, the long N-terminal "M1" form of AQP4 diffused freely, with diffusion coefficient approximately 5 x 10(-10) cm(2)/s, covering approximately 5 microm in 5 min. The short N-terminal "M23" form of AQP4, which by FFEM was found to form OAPs, was relatively immobile, moving only approximately 0.4 microm in 5 min. Actin modulation by latrunculin or jasplakinolide did not affect AQP4-M23 diffusion, but deletion of its C-terminal postsynaptic density 95/disc-large/zona occludens (PDZ) binding domain increased its range by approximately twofold over minutes. Biophysical analysis of short-range AQP4-M23 diffusion within OAPs indicated a spring-like potential, with a restoring force of approximately 6.5 pN/microm. These and additional experiments indicated that 1) AQP4-M1 and AQP4-M23 isoforms do not coassociate in OAPs; 2) OAPs can be imaged directly by total internal reflection fluorescence microscopy; and 3) OAPs are relatively fixed, noninterconvertible assemblies that do not require cytoskeletal or PDZ-mediated interactions for formation. Our measurements are the first to visualize OAPs in live cells.


Figures

Figure 1.
Figure 1.
Characterization of cells expressing c-myc-tagged AQP4. (A) AQP4 schematic showing the positions of Met1 and Met23 (green) in the cytoplasmic N-terminal domain, the inserted c-myc sequence (blue) in the second extracellular loop, and the C-terminal PDZ binding domain (yellow). (B) Confocal micrographs of COS-7 cells transfected with c-myc–tagged AQP4-M1 (left) or AQP4-M23 (right) and labeled with Alexa555. (C) Freeze-fracture electron micrographs of the plasma membrane P-face of COS-7 cells expressing c-myc-tagged AQP4-M1 (left) or AQP4-M23 (right). (D) Osmotic water permeability measurements showing kinetics of osmotically induced cell volume changes (left) and fitted exponential time constants (right) for control COS-7 cells (top) versus cells expressing c-myc–tagged AQP4-M1 (middle) or AQP4-M23 (bottom) (mean ± SE, *p < 0.01 comparing to untransfected cells). Cell cytoplasm was stained with calcein and osmotic volume changed by switching the bathing solution from PBS (300 mOsm) to PBS diluted 1:1 with water (150 mOsm).
Figure 2.
Figure 2.
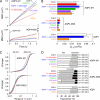
Time-lapse (long-range) single particle tracking of quantum dot-labeled AQP4 at 1 Hz for 6 min. (A) Representative trajectories superimposed on cellular profiles (white regions) of COS-7 cells expressing AQP4-M1 (left) or AQP4-M23 (right). Cells were cotransfected with GFP to identify cell boundaries. (B) Overlay dot-plot of x and y positions of AQP4-M23 trajectories in A, with initial particle positions displaced to the origin (top). Similar plot but after paraformaldehyde fixation (bottom). (C) Combined MSD versus time plots for AQP4-M1 (black) and AQP4-M23 (red). Expanded plot on the bottom also shows MSD for AQP4-M23 in fixed cells (gray). (D) Combined MSD versus time plots for AQP4-M1 (black), AQP4-M23 (red), and M23Δ6 (blue) in untreated COS-7 cells, and after treatment with latrunculin B (green), jasplakinolide (orange), nocodazole (purple) or paraformaldehyde (gray). (E) Cumulative distribution of ranges at 1 min for AQP4 in COS-7 cells, with colors same as in D. (F) Time image series showing codiffusing Qdots (yellow circles) in COS-7 cells expressing M23Δ6. Green and red circles show independently diffusing Qdots. Corresponding trajectories are shown at the far right.
Figure 3.
Figure 3.
Single particle tracking of quantum dot-labeled AQP4 at 91 Hz for 6 s. (A) Representative trajectories of AQP4-M1 (top) and AQP4-M23 (middle), compared with immobilized Qdots on a coverglass (bottom). Examples of AQP4-M23 trajectories shown expanded on the right. Symmetric diffusion in a circular area generally seen (yellow), with Qdot hopping to an adjacent position (green and blue) occasionally seen. (B) MSD versus time plots (top) and cumulative distribution of ranges at 1s (bottom) of COS-7 cells expressing AQP4-M1 (black), AQP4-M23 (red), or both (blue). Dashed curve represents the prediction for an equal amount of AQP4-M1 and AQP4-M23. (C) Combined MSD versus time plots. Top, AQP4-M1 (black) and M1Δ6 (blue) in untreated COS-7 cells, and AQP4-M1 after treatment with latrunculin B (green) or jasplakinolide (orange). Bottom, AQP4-M23 (red) and M23Δ6 (blue) in untreated COS-7 cells, and AQP4-M23 after latrunculin B (green), jasplakinolide (orange), or paraformaldehyde (gray). (D) Cumulative distribution of ranges at 1 s for AQP4 in COS-7 cells, with colors same as in C.
Figure 4.
Figure 4.
Confinement potentials V(r) for diffusion of AQP4 in OAPs in COS-7 cells. (A) Particle positions and corresponding radial density function, d(r)/d(0), for four representative AQP4-M23 trajectories. Solid lines represent best fits to d(r)/d(0) for a spring potential, V(r) ∼ r2. (B) Mean d(r)/d(0) from 215 AQP4-M23 trajectories (± SD) with best fits to indicated V(r). (C) Histograms of spring constants k for AQP4-M23 in untreated COS-7 cells (left) and after treatment with latrunculin (middle left) or jasplakinolide (middle right), and M23Δ6 in untreated cells (right). (D) Average k (± SD) from distributions in C.
Figure 5.
Figure 5.
AQP4-M1 and AQP4-M23 diffusion in different cell types. (A) Combined MSD versus time plots for AQP4-M1 (top) and AQP4-M23 (bottom) in COS-7 cells (black), primary astrocyte cultures from wild-type mouse brain (red) or AQP4 null mouse brain (blue), CHO-K1 cells (green), M23-expressing CHO cells (CHO-M23, purple), and MDCK cells (orange). (B) Average diffusion coefficients of AQP4-M1 (top group), AQP4-M23 (middle group), and AQP1 (bottom group) in indicated cell types (colors same as in A) (mean ± SE). (C) Cumulative distribution of ranges at 1 s for AQP4-M1 (top) and AQP4-M23 (bottom) in different cells (colors as in A). Dashed lines indicate median ranges at 1 s of AQP4-M1 and AQP4-M23 in wild-type astrocytes. (D) Breakdown of diffusional modes as defined by RD analysis. N indicates the total number analyzed of trajectories, with the numbers of cells in parentheses.
Figure 6.
Figure 6.
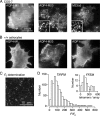
Visualization of AQP4 OAPs by total internal reflection fluorescence microscopy. TIRF micrographs of Alexa555-labeled AQP4-M1, AQP4-M23, and M23Δ6 in COS-7 cells (A) and AQP4-M1, AQP4-M23, and AQP1 in primary astrocyte cultures (B). Insets show expanded 5 × 5 μm areas. (C) TIRF micrograph of single Alexa555 secondary antibodies in AQP4-M1–expressing COS-7 cell labeled at very low density and imaged with 100-fold greater illumination intensity than in A and B. (D) Histogram of background-subtracted area-integrated fluorescence of Alexa555 clusters in six COS-7 cells expressing AQP4-M23. Cluster fluorescence normalized to that of a single Alexa555-labeled secondary antibody. Inset shows histogram of AQP4 tetramers per OAP from FFEM.

References

    1. Amiry-Moghaddam M., Frydenlund D. S., Ottersen O. P. Anchoring of aquaporin-4 in brain: molecular mechanisms and implications for the physiology and pathophysiology of water transport. Neuroscience. 2004;129:999–1010. - PubMed
    1. Crane J. M., Verkman A. S. Long-range nonanomalous diffusion of quantum dot-labeled aquaporin-1 water channels in the cell plasma membrane. Biophys. J. 2008;94:702–713. - PMC - PubMed
    1. Evan G., Lewis G., Ramsay G., Bishop J. Isolation of monoclonal antibodies specific for human c-myc proto-oncogene product. Mol. Cell. Biol. 1985;5:3610–3616. - PMC - PubMed
    1. Frigeri A., Gropper M. A., Umenishi F., Kawashima M., Brown D., Verkman A. S. Localization of MIWC and GLIP water channel homologs in neuromuscular, epithelial and glandular tissues. J. Cell Sci. 1995;108:2993–3002. - PubMed
    1. Fujiwara T., Ritchie K., Murakoshi H., Jacobson K., Kusumi A. Phospholipids undergo hop diffusion in compartmentalized cell membrane. J. Cell Biol. 2002;157:1071–1081. - PMC - PubMed

Publication types

LinkOut - more resources