. 2008 Aug;19(8):3357-68.
doi: 10.1091/mbc.e08-03-0319. Epub 2008 May 21.

The role of myosin II in glioma invasion of the brain

Affiliations

The role of myosin II in glioma invasion of the brain

Christopher Beadle et al. Mol Biol Cell. 2008 Aug.

Abstract

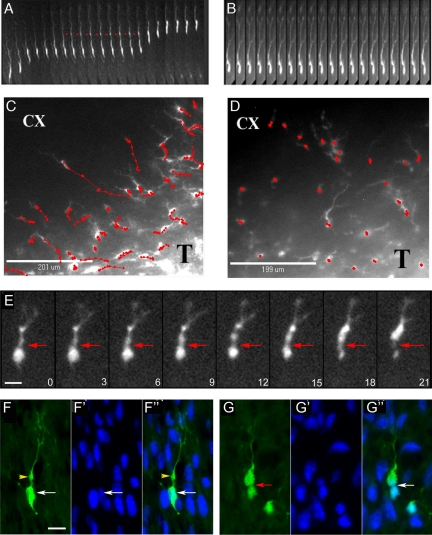
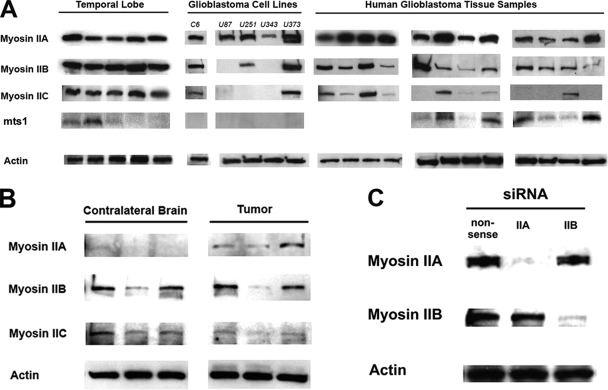
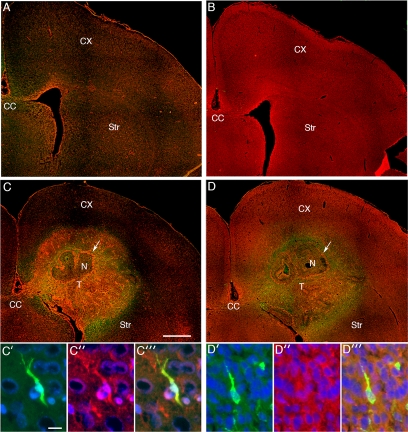
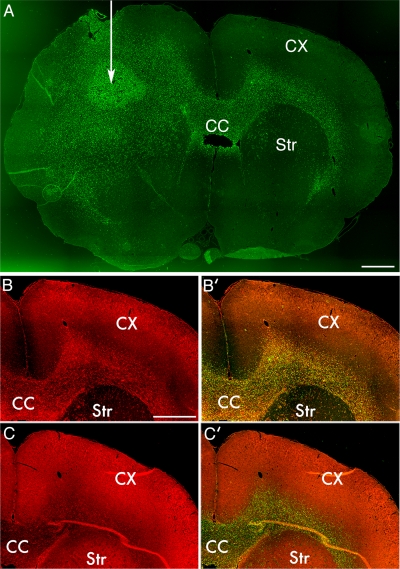
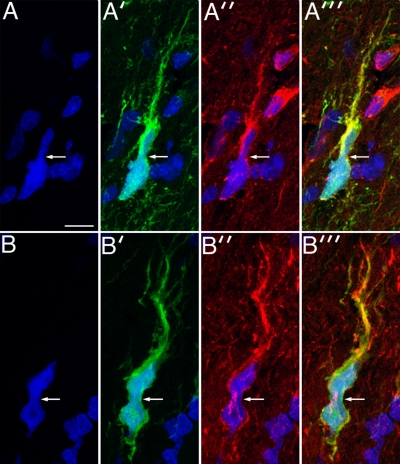
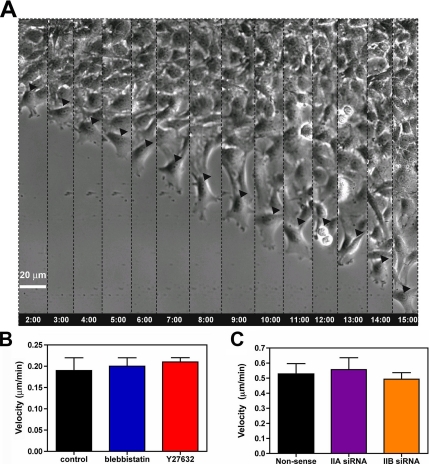
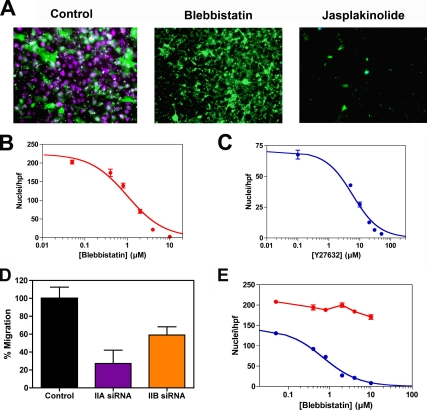
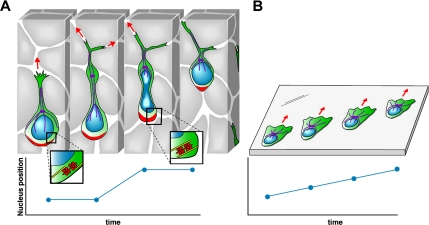
The ability of gliomas to invade the brain limits the efficacy of standard therapies. In this study, we have examined glioma migration in living brain tissue by using two novel in vivo model systems. Within the brain, glioma cells migrate like nontransformed, neural progenitor cells-extending a prominent leading cytoplasmic process followed by a burst of forward movement by the cell body that requires myosin II. In contrast, on a two-dimensional surface, glioma cells migrate more like fibroblasts, and they do not require myosin II to move. To explain this phenomenon, we studied glioma migration through a series of synthetic membranes with defined pore sizes. Our results demonstrate that the A and B isoforms of myosin II are specifically required when a glioma cell has to squeeze through pores smaller than its nuclear diameter. They support a model in which the neural progenitor-like mode of glioma invasion and the requirement for myosin II represent an adaptation needed to move within the brain, which has a submicrometer effective pore size. Furthermore, the absolute requirement for myosin II in brain invasion underscores the importance of this molecular motor as a potential target for new anti-invasive therapies to treat malignant brain tumors.


Figures

Figure 1.
Figure 1.
Brain migration by PDGF-transformed, GFP-expressing rat glioma cells. Time-lapse microscopy was performed on 300-μm-thick slice cultures of PDGF-driven tumors at 10 d after injection. (A) Kymograph constructed from images taken every 15 min over the course of 5 h, illustrating the saltatory movement of a glioma cell as it infiltrates toward the cortex; the red arrow head points to the cytoplasmic swelling that forms in the leading process before nuclear translocation. (B) Kymograph (images taken every 15 min) of a cell in the cortex after the slice has been treated with 50 μM blebbistatin. Note that the cell body remains stationary, whereas the leading cytoplasmic process continues to extend forward. (C and D) Migratory paths of cells (red lines) without (C) and with (D) the addition of 50 μM blebbistatin. The migratory paths (red lines) of individual cells at the infiltrative edge of the tumor (T) and overlying cortex (CX) were tracked by marking the position of the cell body at consecutive time points (red dots correspond to position of cell body at 30-min intervals). (E) Time series (micrographs taken at 3-min intervals) showing the deformation of the cell body during a phase of cell body translocation. The red arrowhead points to a focal narrowing that occurs between the cell body and the swelling in the leading process through which the cell body constricts as it moves forward. (F and G) Micrographs of fixed sections stained for GFP (green) and DAPI (blue) showing GFP-expressing cells at different stages of the migratory sequence. F–F″ show a cell with the nucleus (white arrow) separated from a prominent dilatation in the leading process (yellow arrowhead). G–G″ show a cells with a focal deformation of the cell body and nucleus (red arrow). Bars, 10 μm.
Figure 2.
Figure 2.
Myosin II isoform expression in gliomas. (A) Immunoblot myosin II isoforms from glioma cell and human tissue lysates. β-Actin was used as a loading control. (B) Comparison of myosin II isoform expression in lysates from the rat glioma model generated by intracerebral injection of a PDGF-IRES-GFP–encoding retrovirus, compared with the uninjected contralateral brain. Immunoblot analysis was performed on excisions from three separate rat brains. (C). Immunoblot analysis of myosin IIA and myosin IIB siRNA-transfected U251 cells showing >95% reduction of each isoform. Nonsense siRNA oligos were used as a control.
Figure 3.
Figure 3.
Localization of myosin IIA and IIB in normal rat brain and in the PDGF-driven brain tumor model. (A) Low power micrograph showing the distribution of myosin IIA (red) in the contralateral, normal hemisphere of a tumor-bearing rat. The paucity of staining for myosin IIA is consistent with the immunoblot results in Figure 2B. (B) Low power micrograph showing the distribution of myosin IIB (red) in the contralateral, normal hemisphere. Myosin IIB is diffusely distributed in cortex and white matter in the uninvolved hemisphere. (C) Low power micrograph of the tumor-bearing hemisphere, stained with antibody to myosin IIA. There is increased staining for myosin IIA in the tumor (T) compared with the surrounding brain tissue, cortex (CX), striatum (Str) and corpus callosum (CC). Particularly high levels of staining are seen in the tumor vessels (white arrow). Bar, 1 mm. (C′–C‴) High-power micrographs showing immunostaining for myosin IIA (red) in a GFP-expressing cell (green) that is infiltrating the cortex. Nuclei are stained blue with DAPI. Bar, 10 μm. (D) Low-power micrograph of myosin IIB (red) in the tumor-bearing hemisphere. Increased levels of myosin IIB immunoreactivity are seen in the tumor vessels (white arrow), whereas in most of the tumor (T), the levels of myosin IIB immunoreactivity are similar to that of the surrounding brain tissue. (D′–D‴) High-powered micrograph showing myosin IIB immunoreactivity (red) in a GFP-expressing cell (green) infiltrating the cortex. Nuclei are stained blue with DAPI. The white arrow in C and D points to tumor vessels surrounding an area of necrosis (N).
Figure 4.
Figure 4.
Human glioma xenografts are invasive and demonstrate enhanced myosin IIA expression. (A) Whole brain mount from a nude rat injected with a primary culture derived from a human glioblastoma. White arrow indicates location of the site of tumor inoculation. Tissue sample is stained for human nuclear antigen (green) to demonstrate location of human tumor cells in the rat background. Tumor is seen to have spread across the corpus callosum (CC) to the contralateral white matter, between the cortex (CX) and striatum (Str). Bar, 1 mm. (B) Immunofluorescence localization of myosin IIA demonstrates prominent staining of the infiltrating tumor in the white matter contralateral to the inoculation site. Bar, 1 mm. (B′) Fusion of myosin IIA and human nuclear antigen images demonstrates colocalization. (C) Immunofluorescence localization of myosin IIB demonstrates levels similar to or less than those seen in the surrounding cortex and white matter.
Figure 5.
Figure 5.
Infiltrating human glioma cells undergo the same cell body and nuclear deformation seen in the PDGF-driven glioma model. Panels A and A′ show a GFP-expressing human glioma cell (green) infiltrating the surrounding, normal brain, with nuclear DAPI staining in A and GFP staining in A′. There is strong immunostaining for myosin IIA (red, A″), and these three images are merged in A‴. Bar, 10 μm. B and B′ correspond to DAPI and GFP staining, respectively, of another infiltrating GFP-expressing human glioma cell. This cell demonstrates strong staining for myosin IIB (red, B″). In both sets of micrographs the white arrows point to focal deformation of the cell bodies.
Figure 6.
Figure 6.
Glioma migration in a scrape assay. (A) Migrating cells at the “wound” edge were imaged for 15 h at a frequency of 1 image every 2 min by phase contrast. The figure shows a leading cell (arrowhead) at different 1-h intervals. Migrating cells form a broad lamellipodium, and the nucleus remains undistorted through the course of migration. At the 12-h time point, the cell divided, and the two daughter cells continued to migrate in different directions. Bar, 20 μm. (B) Migration velocity is not appreciably affected by concentrations of blebbistatin or Y27632 that alter cell morphology or block cytokinesis (see Supplemental Video 4). Bars are the SEM (n = 6). (C) Suppression of either myosin IIA or IIB with RNAi (Figure 1C) has no appreciable effect on migration velocity. Bars are the SEM (n = 6).
Figure 7.
Figure 7.
Glioma migration through Transwell membranes. (A) Micrograph of fixed, DAPI-stained C6-GFP cells treated with 10 μM blebbistatin or 200 nM jasplakinolide after being seeded on the upper surface of a 3-μm Fluoroblok transfilter and incubated for 6 h. Although blebbistatin does not prevent the cells from extruding their cytoplasm (green) through the pores, it does block extrusion of the nuclei, as evidenced by the lack of DAPI staining (blue). Jasplakinolide prevents extrusion of both cytoplasm as well as nuclei. (B) Dose response for inhibition of nuclear translocation across the 3-μm membrane by blebbistatin. Data were fit to a hyperbolic isotherm, with Ki = 1.0 ± 0.1 μM. (C) Corresponding dose–response relationship for Y27632, with Ki = 5.8 ± 0.6 μM. (D) Effect of siRNA suppression of myosin IIA and myosin IIB on U251 cell invasion through 3-μm Transwell membranes. After migration toward 10% FBS for 24 h, the cells were fixed and stained with DAPI. Nuclei were counted in several 20× fields of magnification. Data are expressed as mean ± SD per high-powered field. (E) Effect of varying Transwell pore size on the need for myosin II. Dose–response curves for transmigration of C6-GFP cells treated with various concentrations of blebbistatin or Y27632. Cells were fixed and stained with DAPI after 6 h of incubation with either a 3-μm (blue) or 8-μm (red) Fluoroblok transfilter. Data for the 3-μm pores for this set of experiments fit a hyperbolic dose–response relationship, with Ki = 0.7 ± 0.1 μM, very similar to the value derived from the data in Panel B. Nuclei were counted in several 20× fields of magnification. Data are expressed as mean ± SD per high-powered field.
Figure 8.
Figure 8.
Model of how a glioma cell migrates through brain tissue. (A) Starting with the left-most image, the infiltrating glioma cell is depicted as having a prominent leading process that often branches at its distal end. A dilatation forms in the leading process (black arrow). Evidence form neural progenitors show that the centrosome and associated microtubules (purple) move forward into the dilatation (Tsai et al., 2007). The mechanical constraints generated from the small intercellular spaces impede forward movement of the nucleus and cell body until contraction of actomyosin II at the rear of the cell (red) provide the necessary force to squeeze the nucleus through a narrowing in the extracellular space. The graph of nuclear position over time illustrates the resulting saltatory movement. (B). Glioma cells crawling on a two-dimensional surface move in a different manner that more closely resembles the migration of fibroblasts. Migration is associated with formation of broad lamellipodium, the nucleus remains undistorted, and its forward movement is continuous and unimpeded, as illustrated by the linear plot of nuclear position over time. Although myosin II is involved in maintaining cell polarity and shape, its activity is not required for cell motility in this barrier-free environment.

Comment in

  • Mol Biol Cell. 19:3179.

Similar articles

Cited by

References

    1. Amano M., Ito M., Kimura K., Fukata Y., Chihara K., Nakano T., Matsuura Y., Kaibuchi K. Phosphorylation and activation of myosin by Rho-associated kinase (Rho-kinase) J. Biol. Chem. 1996;271:20246–20249. - PubMed
    1. Assanah M., Lochhead R., Ogden A., Bruce J., Goldman J., Canoll P. Glial progenitors in adult white matter are driven to form malignant gliomas by platelet-derived growth factor-expressing retroviruses. J. Neurosci. 2006;26:6781–6790. - PMC - PubMed
    1. Bellion A., Baudoin J. P., Alvarez C., Bornens M., Metin C. Nucleokinesis in tangentially migrating neurons comprises two alternating phases: forward migration of the Golgi/centrosome associated with centrosome splitting and myosin contraction at the rear. J. Neurosci. 2005;25:5691–5699. - PMC - PubMed
    1. Betapudi V., Licate L. S., Egelhoff T. T. Distinct roles of nonmuscle myosin II isoforms in the regulation of MDA-MB-231 breast cancer cell spreading and migration. Cancer Res. 2006;66:4725–4733. - PubMed
    1. Bruehlmeier M., Roelcke U., Blauenstein P., Missimer J., Schubiger P. A., Locher J. T., Pellikka R., Ametamey S. M. Measurement of the extracellular space in brain tumors using 76Br-bromide and PET. J. Nucl. Med. 2003;44:1210–1218. - PubMed

Publication types