. 2008 May 21;28(21):5433-49.
doi: 10.1523/JNEUROSCI.0749-08.2008.

Agouti-related peptide and MC3/4 receptor agonists both inhibit excitatory hypothalamic ventromedial nucleus neurons

Affiliations

Agouti-related peptide and MC3/4 receptor agonists both inhibit excitatory hypothalamic ventromedial nucleus neurons

Li-Ying Fu et al. J Neurosci. .

Abstract

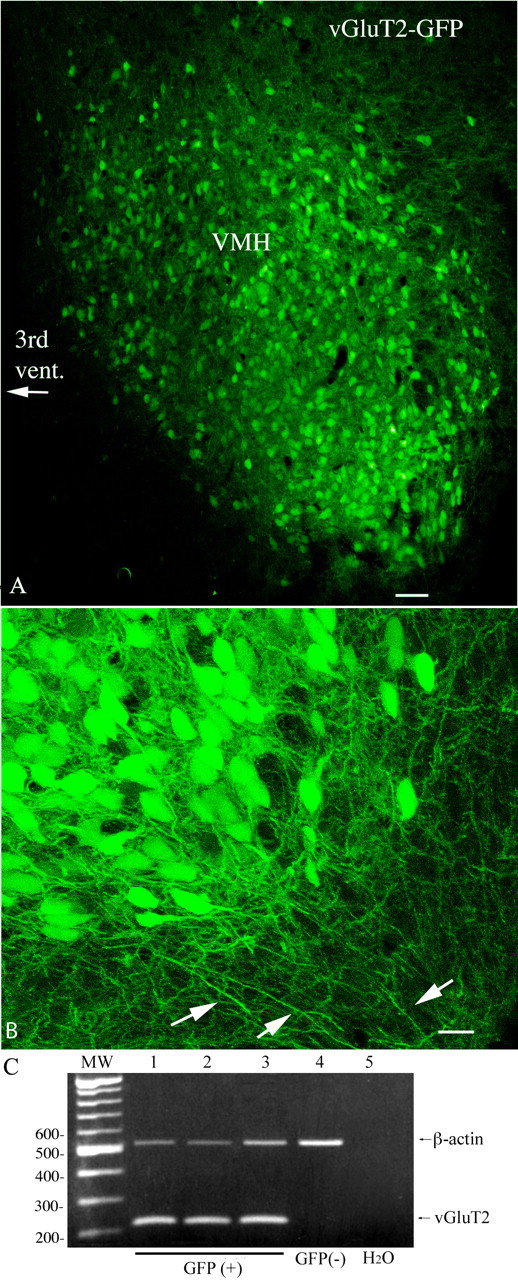
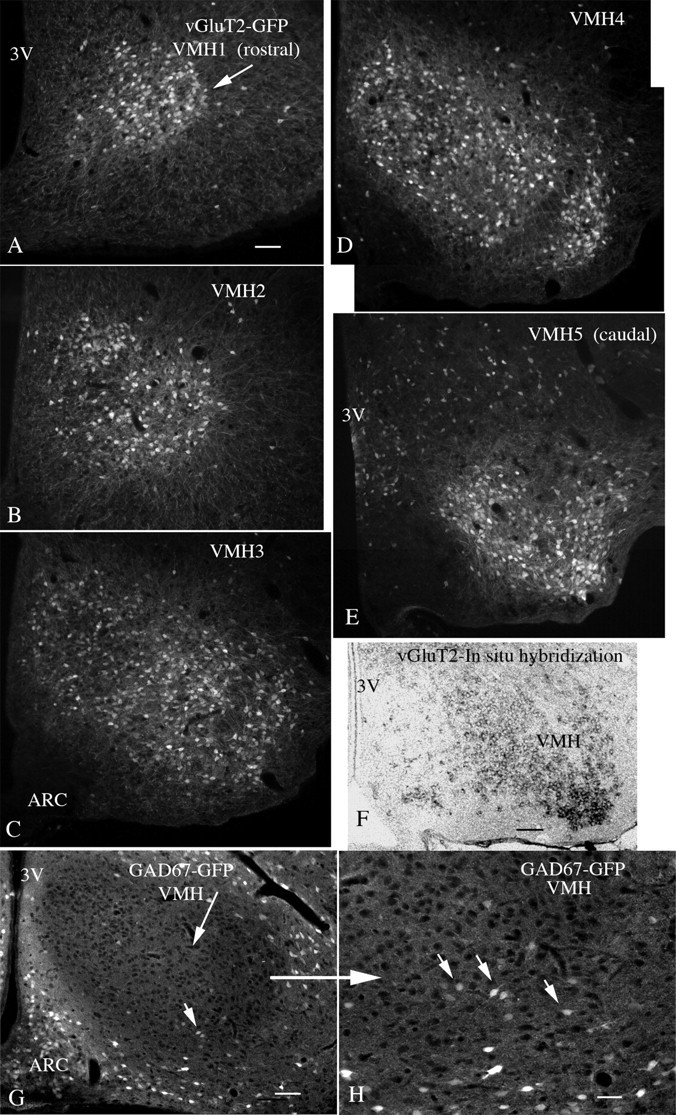
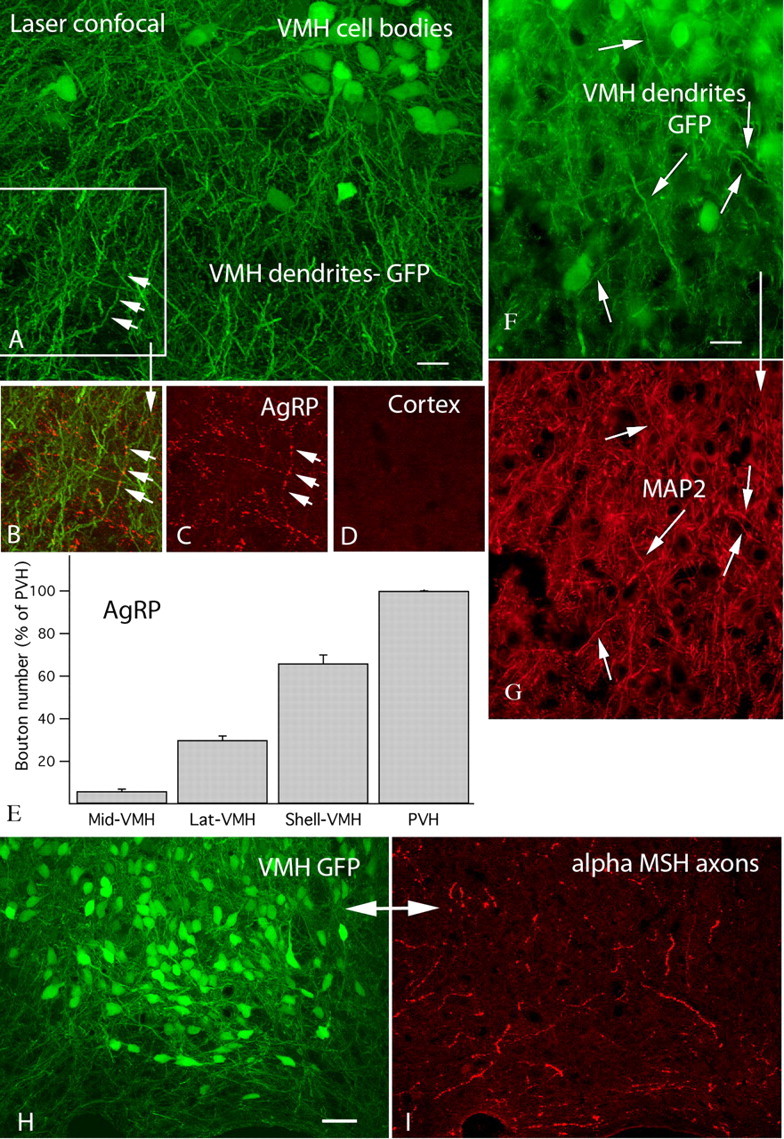
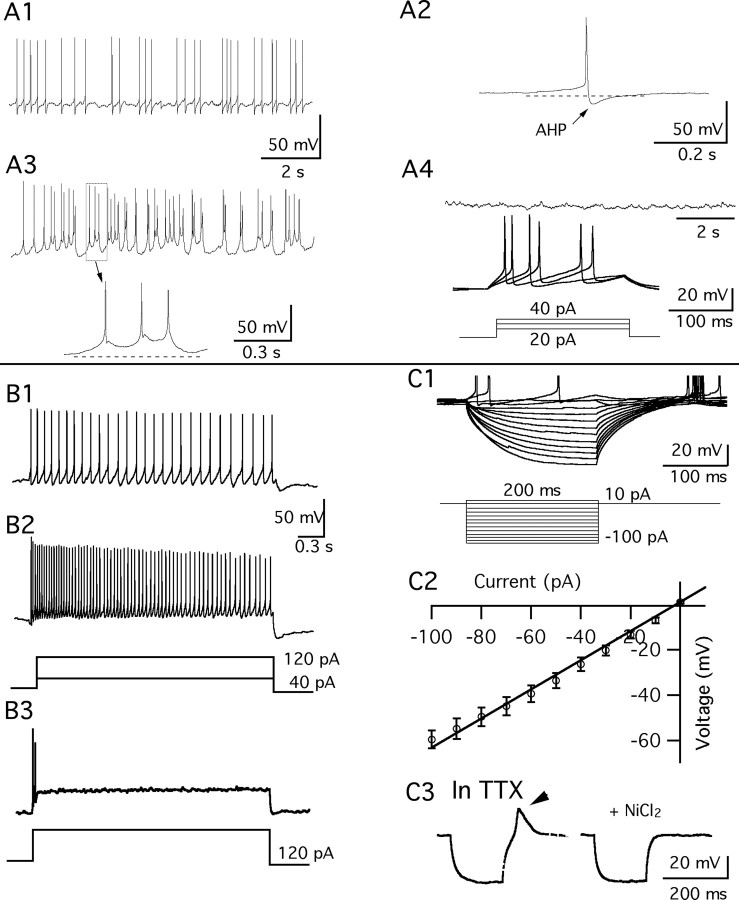
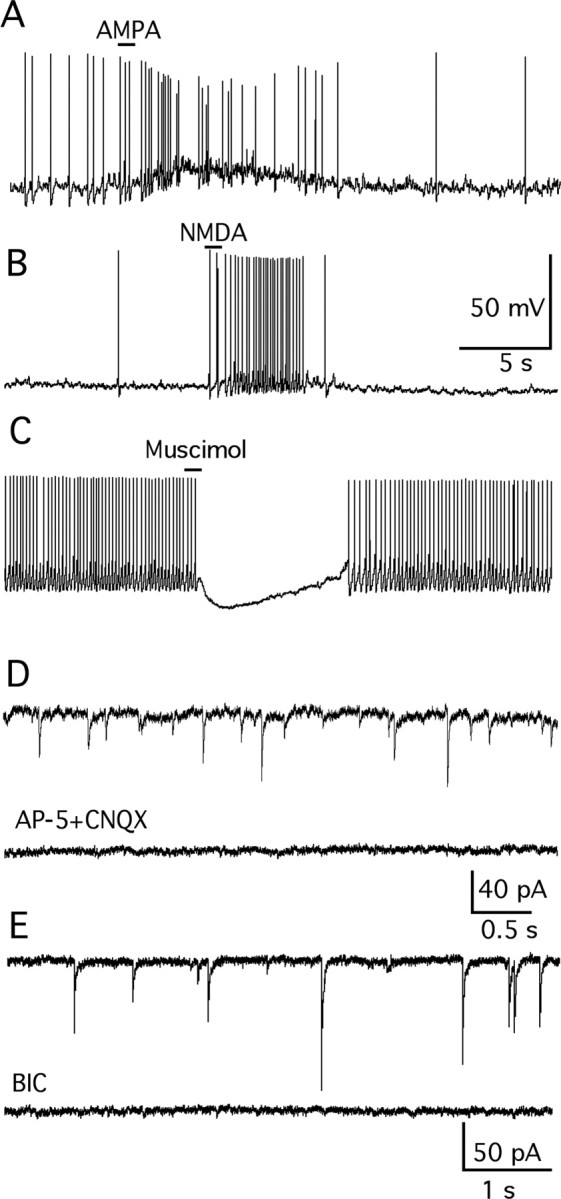
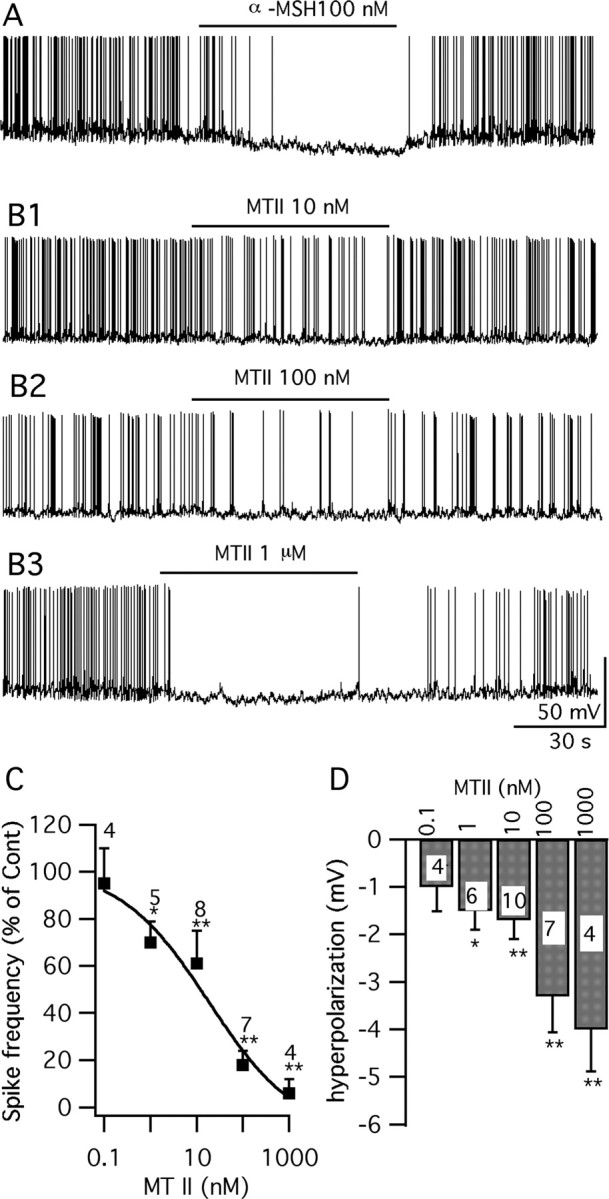
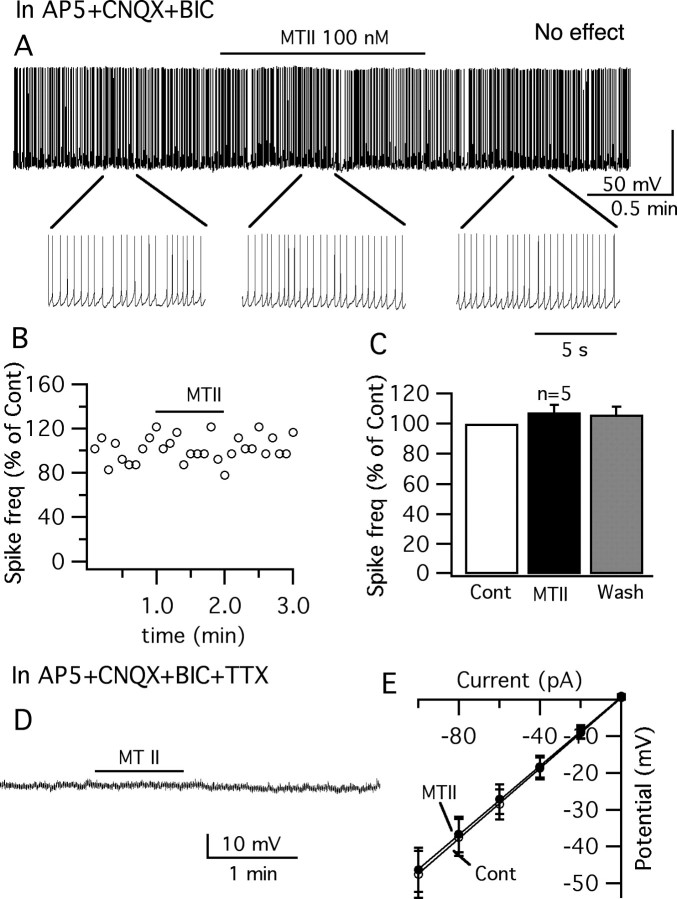
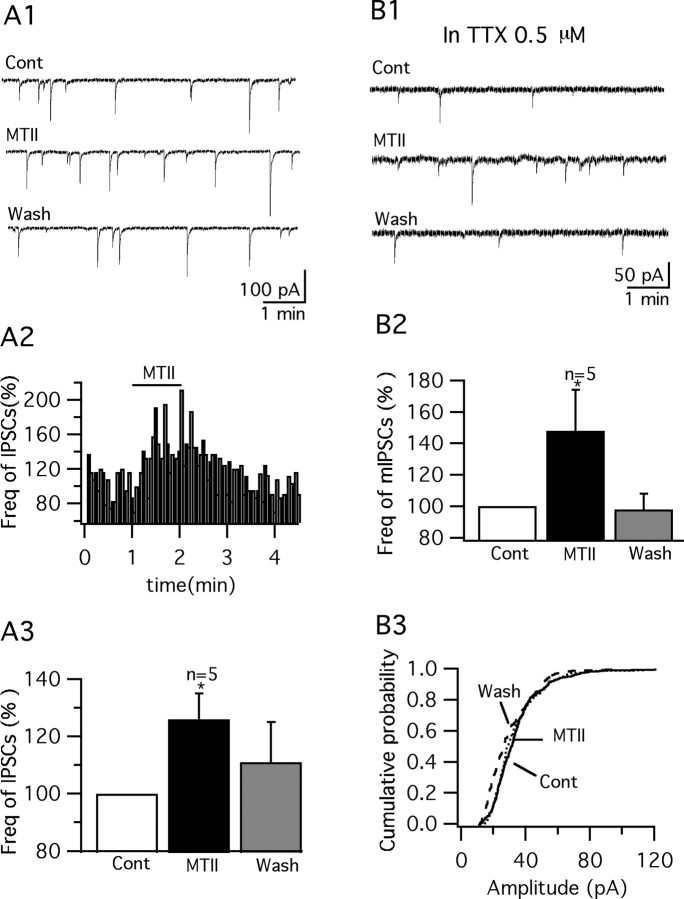
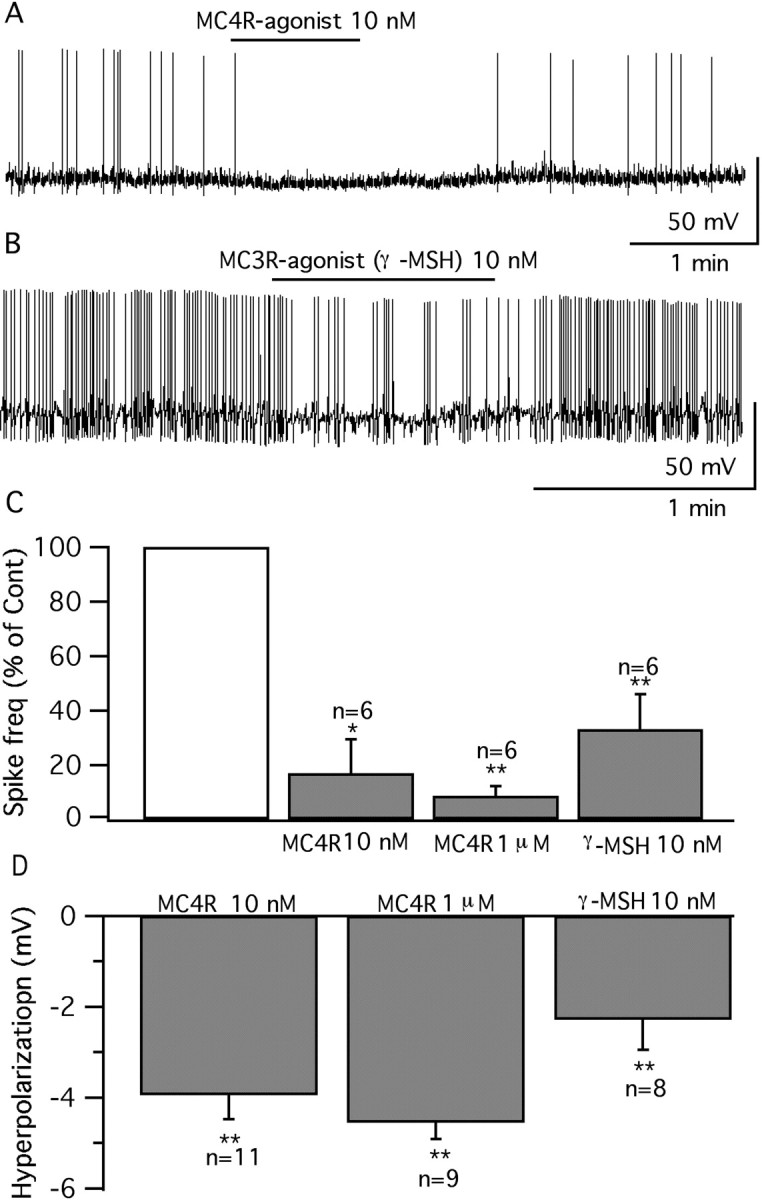
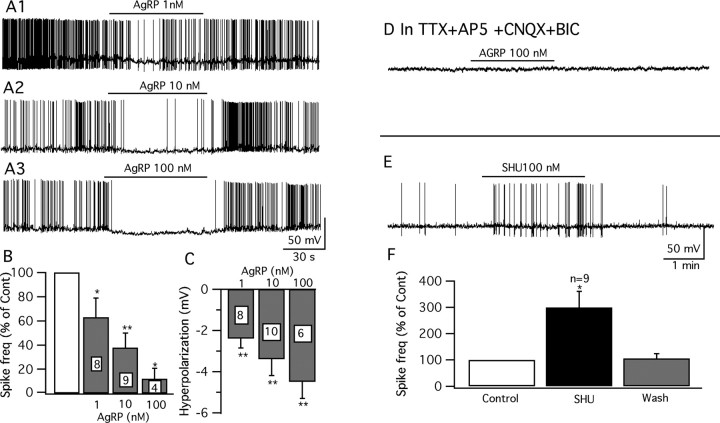
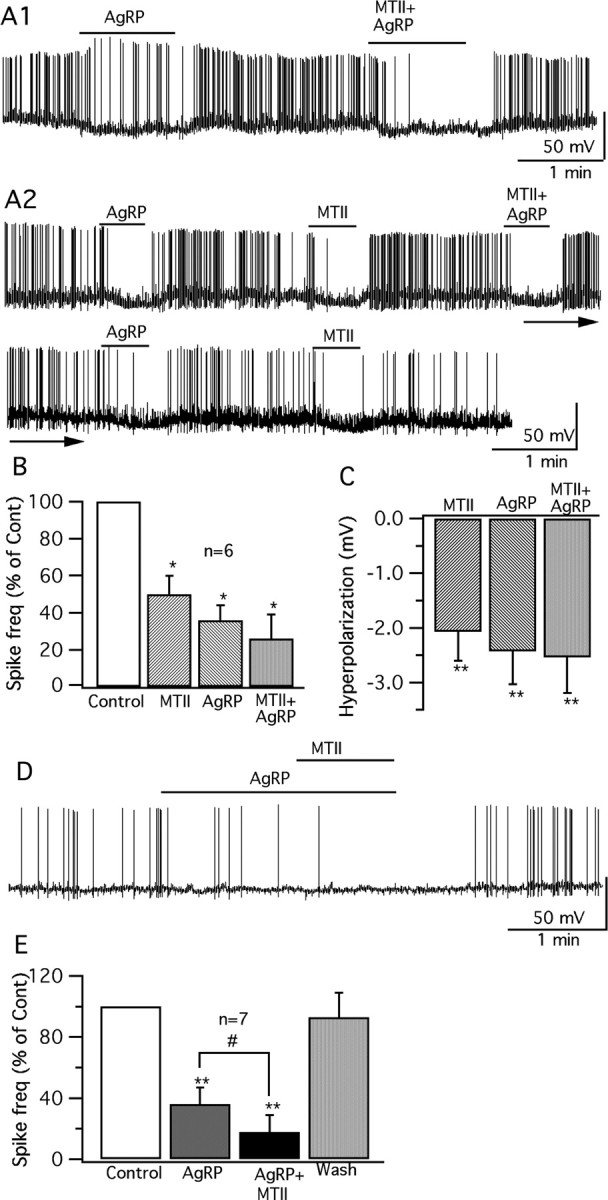
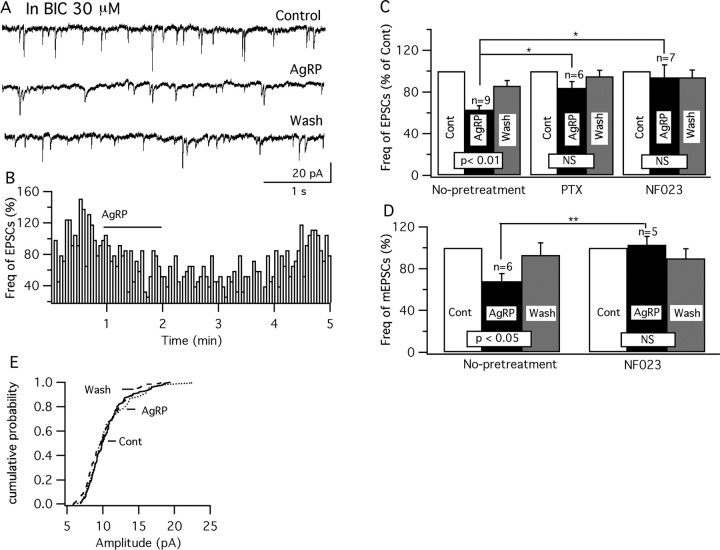
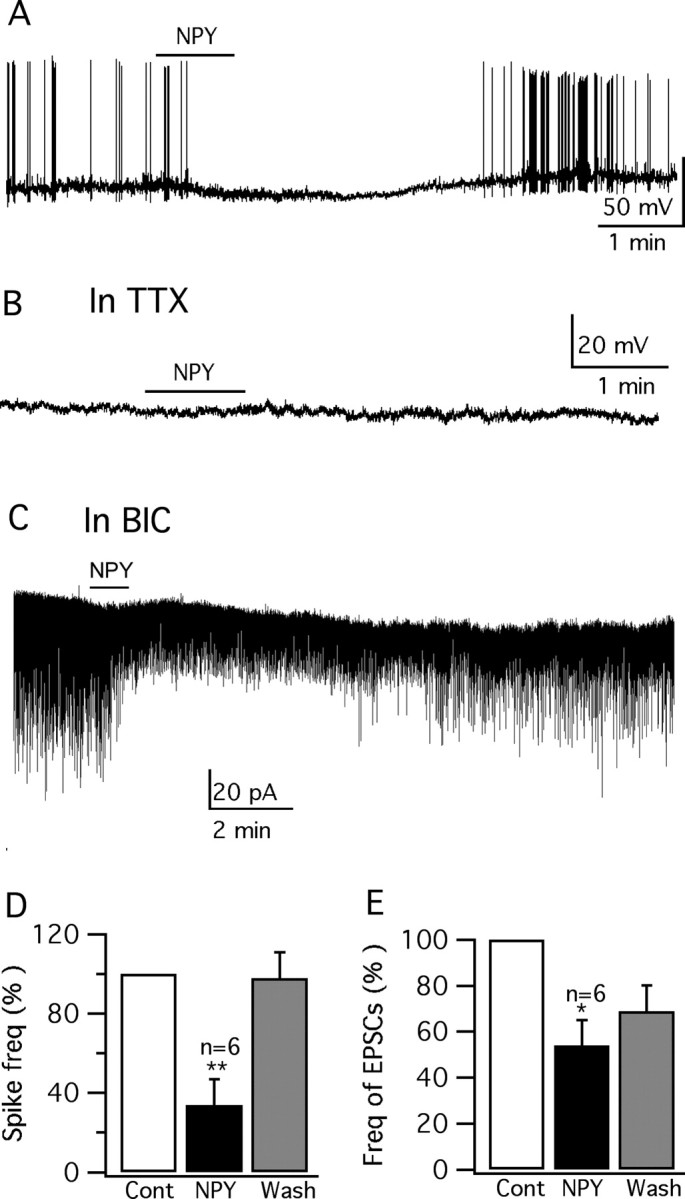
Anorexigenic melanocortins decrease food intake by activating MC3/MC4 receptors (MC3/4R); the prevailing view is that the orexigenic neuropeptide agouti-related peptide (AgRP) exerts the opposite action by acting as an antagonist at MC3/MC4 receptors. A total of 370 hypothalamic ventromedial nucleus (VMH) glutamatergic neurons was studied using whole-cell recording in hypothalamic slices from a novel mouse expressing green fluorescent protein (GFP) under control of the vesicular glutamate transporter 2 (vGluT2) promoter. Massive numbers of GFP-expressing VMH dendrites extended out of the core of the nucleus into the surrounding cell-poor shell. VMH dendrites received frequent appositions from AgRP-immunoreactive axons in the shell of the nucleus, but not the core, suggesting that AgRP may influence target VMH neurons. alpha-MSH, melanotan II (MTII), and selective MC3R or MC4R agonists were all inhibitory, reducing the spontaneous firing rate and hyperpolarizing vGluT2 neurons. The MC3/4R antagonist SHU9119 was excitatory. Unexpectedly, AgRP did not attenuate MTII actions on these neurons; instead, these two compounds showed an additive inhibitory effect. In the absence of synaptic activity, no hyperpolarization or change in input resistance was evoked by either MTII or AgRP, suggesting indirect actions. Consistent with this view, MTII increased the frequency of spontaneous and miniature IPSCs. In contrast, the mechanism of AgRP inhibition was dependent on presynaptic inhibition of EPSCs mediated by G(i)/G(o)-proteins, and was attenuated by pertussis toxin and NF023, inconsistent with mediation by G(s)-proteins associated with MC receptors. Together, our data suggest that the mechanism of AgRP actions on these excitatory VMH cells appears to be independent of the actions of melanocortins on MC receptors.


Figures

Figure 1.
Figure 1.
GFP is expressed selectively in vGluT2-containing neurons in VMH. A, GFP-expressing cells in a slice from VMH. Scale bar, 45 μm. B, High-magnification laser confocal image showing the ventrolateral VMH with GFP-expressing processes. Scale bar, 12 μm. C, Photograph of an ethidium bromide-stained gel with single-cell PCR amplicons showing that all GFP-expressing neurons (lanes 1–3) in the VMH are vGluT2 positive, whereas the cell that did not express GFP (lane 4) is vGluT2 negative. A total of 30 GFP-positive cells were harvested from the VMH, and all 30 were positive for vGluT2 mRNA. Lane 5 is the negative PCR control replacing template with water. The molecular weight marker is a successive 100 bp DNA ladder.
Figure 2.
Figure 2.
Rostrocaudal expression of GFP in VMH. A–E show GFP expression (white fluorescent cells) in successive rostrocaudal levels of the VMH of the vGluT2-GFP mouse, starting rostrally in A, and proceeding caudally to E (rostral to caudal: VMH1–VMH5). Scale bar, 60 μm. F, In situ hybridization with a probe for vGluT2 mRNA shows expression (dark cells) in the VMH, corresponding to a similar level in E. Scale bar, 60 μm. G shows a VMH section from a transgenic mouse expressing GFP in GABA neurons under control of the GAD67 promoter. The VMH is darker than the surrounding area, but isolated GABA cells can be found. Scale bar, 60 μm. H, Higher magnification in the area of the small arrow in G. Small arrows indicate GABA-GFP neurons. Scale bar, 28 μm. 3V, Third ventricle; ARC, arcuate nucleus.
Figure 3.
Figure 3.
AgRP immunoreactive axons abundant in shell of VMH. A, Laser confocal micrograph of VMH dendrites exiting the ventrolateral region of the nucleus. The dendrite shown by three arrows is also seen in B and C. Scale bar, 16 μm. B, Red AgRP-immunoreactive boutons run along a green VMH dendrite making numerous appositions. C, Only the red AgRP-immunoreactive axons are shown. D, Control section in cortex shows no immunoreactive axons. E, Relative number of AgRP-immunoreactive axonal boutons. Note the higher bouton density in the lateral VMH and shell. Error bars indicate SEM. F, GFP-expressing dendrites in shell of the VMH. Scale bar, 13 μm. G, Immunostaining with the dendritic marker MAP2 labels the same processes, consistent with the view that the processes are dendrites. H, GFP-expressing cells and processes in the ventrolateral VMH. Scale bar, 25 μm. I, In the same field as H, immunoreactive α-MSH axons are found in and around the ventrolateral VMH.
Figure 4.
Figure 4.
Membrane properties of vGluT2 neurons. A1, Spontaneous firing of a GFP-VMH neuron at resting membrane potential (−52.5 mV). A2, Single action potential from A1. A3, A cell showing spontaneous bursting firing at rest (−55.1 mV). A4, Silent neuron at resting membrane potential of −72.5 mV (top trace), which fired on current injection of 20–40 pA (bottom trace). B1, B2, Voltage responses of a GFP-neuron to 3 s step current injections of 40 and 120 pA. B3, A cell failed to fire continuously during the 3 s current injection of 120 pA. C1, Voltage traces evoked by a step current injection from −100 to 10 pA. C2, Mean current–voltage relationship of 20 GFP-neurons. C3, Traces show that a LTS was evoked when the cell recovered from a hyperpolarization to −75 mV; the LTS persisted in TTX, but was abolished by NiCl2 (200 μm).
Figure 5.
Figure 5.
Response of vGluT2 neurons to amino acid neurotransmitters. A, Glutamate receptor agonist AMPA (30 μm) induced a robust increase of spikes and depolarized the membrane potential in current-clamp recording at rest (−54 mV). B, NMDA (50 μm) evoked a burst of spikes and a depolarization in a cell at rest (−51.5 mV). C, GABAA receptor agonist muscimol (30 μm) attenuated the spike frequency and hyperpolarized the membrane potential at rest (−58.8 mV). D, Spontaneous EPSCs recorded with KMeSO4 in the pipette solution and BIC (30 μm) in the bath in voltage clamp (top trace). EPSCs were completely blocked by application of glutamate antagonists AP5 (50 μm) and CNQX (10 μm) (bottom trace). E, Spontaneous IPSCs were recorded in the presence of AP5 and CNQX and using KCl in the pipette solution (top trace). IPSCs were completely blocked by 30 μm BIC (bottom trace).
Figure 6.
Figure 6.
α-MSH and MTII inhibit vGluT2 neurons. A, A trace showing that α-MSH (100 nm) depressed vGluT2 neurons. B1–B3, Traces showing that 10 nm ∼ 1 μm MTII inhibits the firing and hyperpolarizes the membrane potential of GFP-VMH neurons. C, Spike frequency dose-dependent response of MTII. D, Bar graph showing the hyperpolarization of membrane after application of MTII (0.1 nm ∼ 1 μm) (*p < 0.05; **p < 0.01; ANOVA). Error bars indicate SEM. n is shown as a number inside each bar.
Figure 7.
Figure 7.
No inhibitory activity of MTII on vGluT2 neurons was found when synaptic transmission was blocked. A, Trace showing that the vGluT2 neuron is not inhibited by MTII in the presence of glutamate and GABA receptor antagonists, AP5, CNQX, and BIC, respectively. B, Time course of the response to MTII on spike frequency in the neuron shown in A. C, Bar graph showing that the spike frequency is not decreased by MTII in the presence of AP5, CNQX, and BIC. Error bars indicate SEM. D, Representative trace showing little effect of MTII on membrane potential in the presence of TTX, AP5, CNQX, and BIC. E, MTII did not change the input resistance (n = 9).
Figure 8.
Figure 8.
MTII reversibly increased IPSCs and mIPSCs in GFP-VMH neurons. A1, Representative traces showing the effect of MTII (100 nm) on IPSCs in a typical GFP-VMH cell. A2, Time course of MTII-induced enhancement of IPSCs. A3, Bar graph showing the mean facilitation of MTII on IPSCs (*p < 0.05; ANOVA). Error bars indicate SEM. B1, MTII (100 nm) increased mIPSCs in a typical GFP-VMH neuron in the presence of TTX (0.5 μm). B2, Bar graph showing the mean enhancement of mIPSCs after application of MTII (*p < 0.05; ANOVA). B3, MTII did not change the amplitude of mIPSCs.
Figure 9.
Figure 9.
Selective MC4R and MC3R agonists both depress vGluT2 neurons. A, A cell depressed by MC4R agonist (10 nm) under current-clamp recording. B, A cell depressed by MC3R agonist d-Trp8-γ-MSH (10 nm). C, Bar graphs showing the average spike frequency after application of MC4R agonist (10 nm, 1 μm) and γ-MSH (10 nm) (control, 100%). *p < 0.05; **p < 0.01; ANOVA. Error bars indicate SEM. D, Mean hyperpolarization of the membrane potential by MC4R agonist (10 nm and 1 μm) and γ-MSH (10 nm). **p < 0.01; ANOVA.
Figure 10.
Figure 10.
Opposite effects of AgRP and SHU9119 on vGluT2 neurons. A1–A3, AgRP (1–100 nm) inhibited the firing and hyperpolarized the membrane of vGluT2 VMH neurons. B, Bar graph showing the dose-dependent depression on average spike frequency by AgRP (1–100 nm) (control, 100%; *p < 0.05; **p < 0.01; ANOVA). Error bars indicate SEM. C, Bar graph showing the hyperpolarization of AgRP (1–100 nm) on GFP neurons. D, Typical trace showing that AgRP (100 nm) does not change the membrane potential with TTX (0.5 μm), AP5 (50 μm), CNQX (10 μm), and BIC (30 μm) in the bath solution. E, Cell that was excited by SHU9119 (SHU) (100 nm). F, Bar graph showing the percentage of spike frequency increased by SHU9119 (SHU) (100 nm) on these cells (*p < 0.05; ANOVA).
Figure 11.
Figure 11.
Additive effect of AgRP and MTII on vGluT2 neurons. A1, A vGluT2 cell inhibited by AgRP (10 nm) was inhibited further when both MTII (10 nm) and AgRP (10 nm) were applied. A2, Trace showing that both MTII and AgRP, at 10 nm concentration, show inhibitory effect when applied sequentially on the same cell; coadministration of these two drugs also depresses the cell; and the effects of these two drugs are repeatable. B, Bar graph shows the decrease in spike frequency with MTII (10 nm) and AgRP (10 nm) applied alone and together (*p < 0.05; n = 6; ANOVA). Error bars indicate SEM. C, Bar graph shows the hyperpolarization of the membrane after application of MTII (10 nm) and AgRP (10 nm) alone and together. D, A trace showing that, after pretreatment with AgRP (10 nm), a vGluT2 neuron was still further inhibited after adding MTII (10 nm). E, Bar graph comparing the spike frequency during application of AgRP (10 nm) alone and coapplication with MTII (**p < 0.01; #p < 0.05; n = 7; ANOVA).
Figure 12.
Figure 12.
AgRP reduces excitatory synaptic currents by presynaptic Gi/o G-protein mediation. A, Traces showing that AgRP (100 nm) reversibly decreased the frequency of spontaneous EPSCs, recorded with BIC (30 μm) in the bath. B, Time course of AgRP (100 nm) actions on EPSCs. C, Bar graphs show the mean frequency of EPSCs before, during, and after application of AgRP (100 nm) in normal conditions and after the slices were pretreated with PTX or NF023. The effects of AgRP were significantly attenuated when slices were pretreated with PTX or NF023; the slight reduction in EPSC frequency induced by AgRP after treatment with PTX or NF023 was not significantly different (NS) from the pre-AgRP control frequency. The statistical indication placed within each set of bars indicates a within-group ANOVA comparison (i.e., AgRP caused a statistically significant decrease under control conditions). The horizontal lines above the bars (*p < 0.05; t test) indicate that AgRP under control conditions induced a statistically greater decrease in EPSC frequency than did AgRP in the presence of PTX or NF023. Error bars indicate SEM. D, Bar graphs showing the mean frequency of mEPSCs was depressed by AgRP in normal conditions (p < 0.05; n = 6; ANOVA), whereas no depression was observed after the slices were pretreated with NF023. NF023 caused a statistically significant attenuation in the reduction of EPSC frequency (**p < 0.01; t test). E, Whereas AgRP did attenuate the frequency of mEPSCs under normal conditions, it did not change the amplitude (p > 0.05; n = 6; t test).
Figure 13.
Figure 13.
NPY inhibits vGluT2-GFP neurons. A, Trace showing that application of NPY (1 μm) inhibits the firing and hyperpolarizes the GFP-VMH cell. B, In the presence of TTX (0.5 μm) in the bath solution, no hyperpolarization is induced by NPY (1 μm). C, In the presence of BIC (30 μm), NPY (1 μm) attenuates the spontaneous EPSCs. D, E, Bar graphs showing the decrease of spike frequency and EPSCs mediated by NPY (1 μm) (*p < 0.05; **p < 0.01; ANOVA). Error bars indicate SEM.

Similar articles

Cited by

References

    1. Acuna-Goycolea C, Tamamaki N, Yanagawa Y, Obata K, van den Pol AN. Mechanisms of neuropeptide Y, peptide YY, and pancreatic polypeptide inhibition of identified green fluorescent protein-expressing GABA neurons in the hypothalamic neuroendocrine arcuate nucleus. J Neurosci. 2005;25:7406–7419. - PMC - PubMed
    1. Beart PM, Nicolopoulos LS, West DC, Headley PM. An excitatory amino acid projection from ventromedial hypothalamus to periaqueductal gray in the rat: autoradiographic and electrophysiological evidence. Neurosci Lett. 1988;85:205–211. - PubMed
    1. Bednarek MA, MacNeil T, Tang R, Kalyani RN, Van der Ploeg LH, Weinberg DH. Potent and selective peptide agonists of alpha-melanotropin action at human melanocortin receptor 4: their synthesis and biological evaluation in vitro. Biochem Biophys Res Commun. 2001;286:641–645. - PubMed
    1. Beindl W, Mitterauer T, Hohenegger M, Ijzerman AP, Nanoff C, Freissmuth M. Inhibition of receptor/G protein coupling by suramin analogues. Mol Pharmacol. 1996;50:415–423. - PubMed
    1. Bekkers JM, Stevens CF. Quantal analysis of EPSCs recorded from small numbers of synapses in hippocampal cultures. J Neurophysiol. 1995;73:1145–1156. - PubMed

Publication types

MeSH terms

Substances

LinkOut - more resources