. 2008 May 21;28(21):5494-503.
doi: 10.1523/JNEUROSCI.0651-08.2008.

Action-based body maps in the spinal cord emerge from a transitory floating organization

Affiliations

Action-based body maps in the spinal cord emerge from a transitory floating organization

Marcus Granmo et al. J Neurosci. .

Abstract

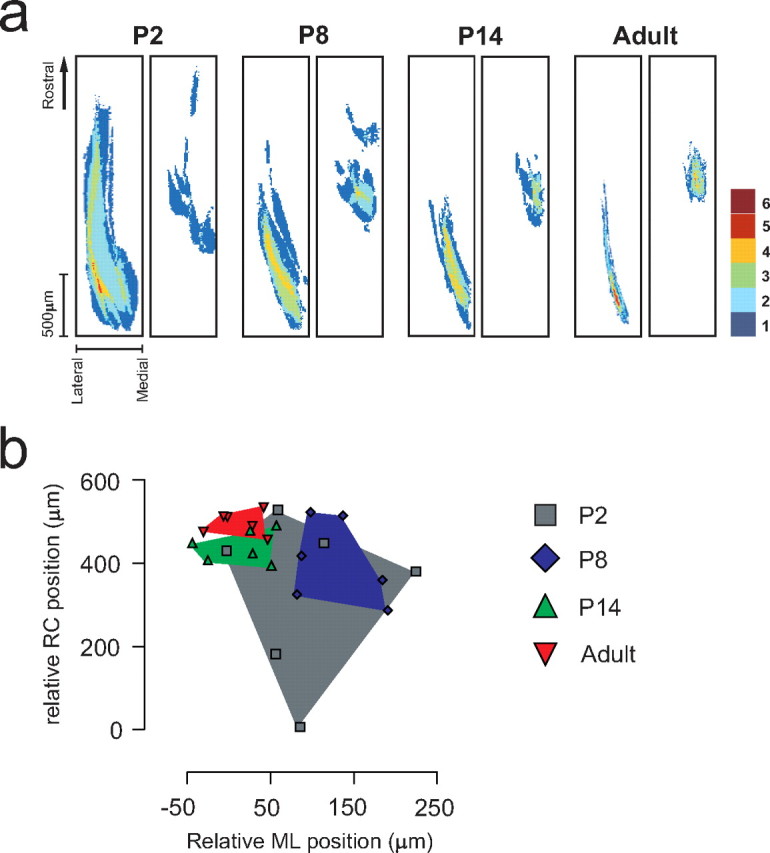
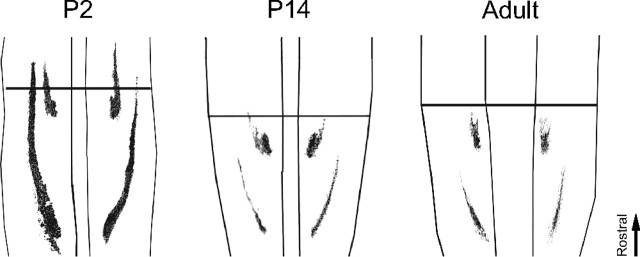
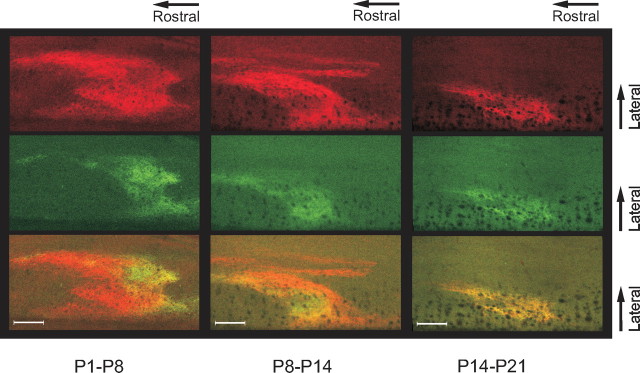
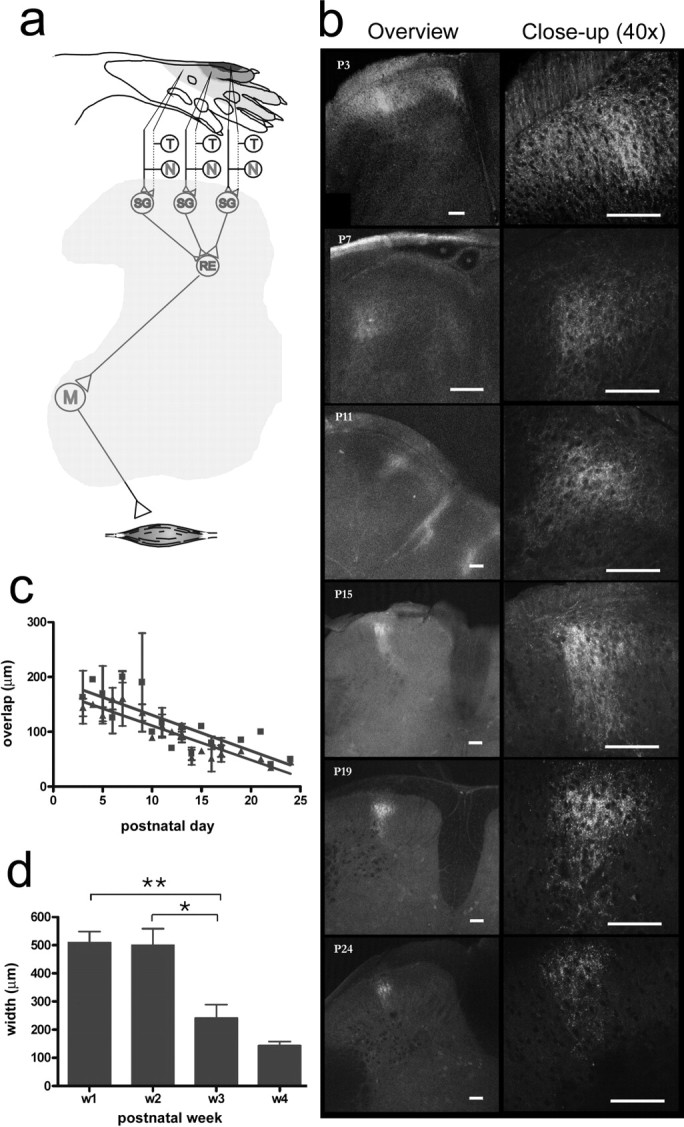
During development primary afferents grow into and establish neuronal connections in the spinal cord, thereby forming the basis for how we perceive sensory information and control our movements. In the somatosensory system, myriads of primary afferents, conveying information from different body locations and sensory modalities, get organized in the dorsal horn of the spinal cord so that spinal multisensory circuits receive topographically ordered information. How this intricate pathfinding is brought about during development is, however, largely unknown. Here we show that a body representation closely related to motor patterns emerges from a transitory floating and plastic organization through profound activity-dependent rewiring, involving both sprouting and elimination of afferent connections, and provide evidence for cross-modality interactions in the alignment of the multisensory input. Thus, far from being inborn and stereotypic, the dorsal horn of the spinal cord now appears to be a highly adaptive brain-body interface.


Figures

Figure 1.
Figure 1.
Large and highly variable primary afferent termination fields in neonate rats are reorganized during development. a, Superimposed labeling patterns from six animals in each age group after subcutaneous tracer injections in the left heel (left) and in the right digit 4 (right). Labeled termination areas in each animal were rostrocaudally aligned with respect to the caudalmost border of the heel projection. The right border in each panel indicates the medial border of the dorsal horn (mediolateral orientation is reversed in right panels to mimic left-side labeling patterns). The color code in each pixel denotes the number of animals in which labeled terminals were found in the corresponding area. b, Relative location of termination foci. RC and ML locations of digit 4 termination foci relative to that of the heel in individual animals for different postnatal ages are shown. Positive RC and ML values indicate that the digit 4 focus is located rostral and medial to that of the heel focus, respectively. All ages are scaled to P2 spinal cord size (for scale factors and calculation of coordinates of foci, see Materials and Methods).
Figure 2.
Figure 2.
Symmetrical bilateral labeling patterns in individual animals. Samples of dorsal-view maps of termination patterns in left and right dorsal horn laminas III–IV after bilateral injections of B-HRP into the heel and digit 4 in single P2, P14, and adult animals. All images are scaled to P2 spinal cord size and rostrocaudally aligned with respect to the caudal heel termination field.
Figure 3.
Figure 3.
Changes in individual terminal field morphology during the first 2 weeks. Three animals of different age received consecutive digit 4 labeling at different time points. Left, A P8 animal injected with red CTb at P1 and green CTb at P5. Middle, A P14 animal injected at P8/P11. Right, A P21 animal injected at P14/P18. Note the large nonoverlapping areas in the P8 and to some extent the P14 animal, but almost complete overlap at P21. Scale bars, 100 μm.
Figure 4.
Figure 4.
Developmental reorganization of coarse and thin afferent terminations from the NWR receptive field of the PL. a, Schematic of the immature PL NWR module: note the tactile-nociceptive convergence in the superficial dorsal horn. T/N, Tactile/nociceptive; SG, substantia gelatinosa interneurons; RE, reflex encoding multimodal interneurons; M, motor neurons. The quantified PL NWR receptive field (top) is shown as blue shaded isoresponse areas; colors denote >70%, 30–70%, and 0–30% of maximum values. b, Examples of images collected at different developmental time points (P3–P24). CTb-labeled fibers (red) traverse the WGA (green)-labeled zone in the first 2 weeks. During the third week, the laminar overlap decreases, and terminal fields narrow mediolaterally into a columnar structure. c, The mediolateral (red) and dorsoventral (green) maximum width of the overlap zone of thin and coarse afferents (postnatal days 3–24; linear regression slopes/0; p < 0.0001). d, Mediolateral maximum width of the thin fiber terminal field during postnatal development (p < 0.0001, Kruskal–Wallis test, *p < 0.05; **p < 0.01, Dunn's multiple-comparison post test. Scale bars, 100 μm.
Figure 5.
Figure 5.
Termination fields of coarse fibers in the neonate. Transverse sections were taken 12, 18, and 48 h after skin CTb injection. Two parallel projections were visible after 18 h. Scale bars, 100 μm.
Figure 6.
Figure 6.
Pharmacological manipulations disrupt the refinement of terminal fields. Samples of digit 4 terminations in P21 animals treated with either vehicle (left) or MK-801 (middle) and P2 animals (right; scaled to P21 size) as a reference. Top and bottom panels in each treatment group show the results obtained from two different animals. Mediolateral (Med-Lat) positions from midline of the terminal foci (x-marked) in individual animals are plotted below. Note the large interindividual variation in MK-801-treated animals and in P2 pups.
Figure 7.
Figure 7.
Pharmacological and sensory manipulations disrupt functional adaptation of sensory processing in the nociceptive withdrawal reflex. a, Normal developmental functional adaptation of tail withdrawal reflexes in the horizontal plane in three litters. Error rate denotes the proportion of erroneous reflex movements, i.e., toward instead of away from the nociceptive stimulus [modified from Waldenstrom et al. (2003)]. b, MK-801-treated animals (▴; n = 12) displayed significantly higher tail reflex error rates than vehicle-treated pups (■; n = 10; p = 0.029; Mann–Whitney). c, The mean number of action potentials and the corresponding SD for 16 standard sites are plotted for PL [vibrated (gray; n = 7), vehicle (cyan; n = 4), and MK-801 (purple; n = 6)]. The average spontaneous activity recorded before stimulation has been subtracted from poststimulus values; as a consequence, inhibition results in a negative number of action potentials. It can be seen that the vibration-treated pups displayed large interindividual response variability close to the receptive field periphery (encircled values). Note also the expansion of the excitatory receptive fields into skin areas normally producing inhibition, in vibrated and MK-801-treated animals. d, Examples of quantified NWR receptive fields of PL and EDL obtained during the fourth postnatal week. MK-801-treated and vibrated animals exhibited inappropriate and flattened receptive fields, respectively. Vehicle-treated animals displayed normal adult-like receptive fields [in agreement with previous results (Holmberg and Schouenborg, 1996)]. Illustrated receptive fields were constructed from quantified EMG responses (mean of 10 mappings) by stimulation of 16 standardized skin sites; values from intermediate sites were interpolated by spatial low-pass filtering.
Figure 8.
Figure 8.
Sensory manipulations disrupt refinement of terminal fields. a, In vibrated rats, the large overlap between thin and coarse fibers, normally present only in the neonate, remained (samples from end of second and third weeks shown). Overlap was often strongest in the caudal segments. A weak medial scatter of CTb-labeled terminals also persisted during the first 3 weeks in the majority of vibrated animals. Red, CTb; green, WGA. Scale bars, 100 μm. b, Terminal overlap of thin and coarse fibers is significantly larger in rats vibrated (V) from birth than in age matched (P13–P24) controls (C) mediolaterally (ML; red) and dorsoventrally (DV; green; *p < 0.05; ***p < 0.001, Mann–Whitney).

References

    1. Altman J, Bayer SA. The development of the rat spinal cord. Adv Anat Embryol Cell Biol. 1984;85:1–164. - PubMed
    1. Amir R, Kocsis JD, Devor M. Multiple interacting sites of ectopic spike electrogenesis in primary sensory neurons. J Neurosci. 2005;25:2576–2585. - PMC - PubMed
    1. Beggs S, Torsney C, Drew LJ, Fitzgerald M. The postnatal reorganization of primary afferent input and dorsal horn cell receptive fields in the rat spinal cord is an activity-dependent process. Eur J Neurosci. 2002;16:1249–1258. - PubMed
    1. Brown PB, Koerber HR, Millecchia R. Assembly of the dorsal horn somatotopic map. Somatosens Mot Res. 1997;14:93–106. - PubMed
    1. Brown PB, Koerber HR, Millecchia R. From innervation density to tactile acuity: 1. Spatial representation. Brain Res. 2004;1011:14–32. - PubMed

Publication types

MeSH terms

LinkOut - more resources