

Lapsing during sleep deprivation is associated with distributed changes in brain activation
- PMID: 18495886
- PMCID: PMC6670628
- DOI: 10.1523/JNEUROSCI.0733-08.2008
Lapsing during sleep deprivation is associated with distributed changes in brain activation
Abstract
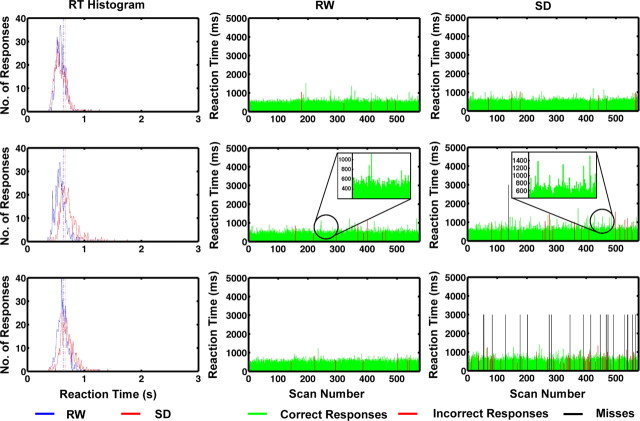
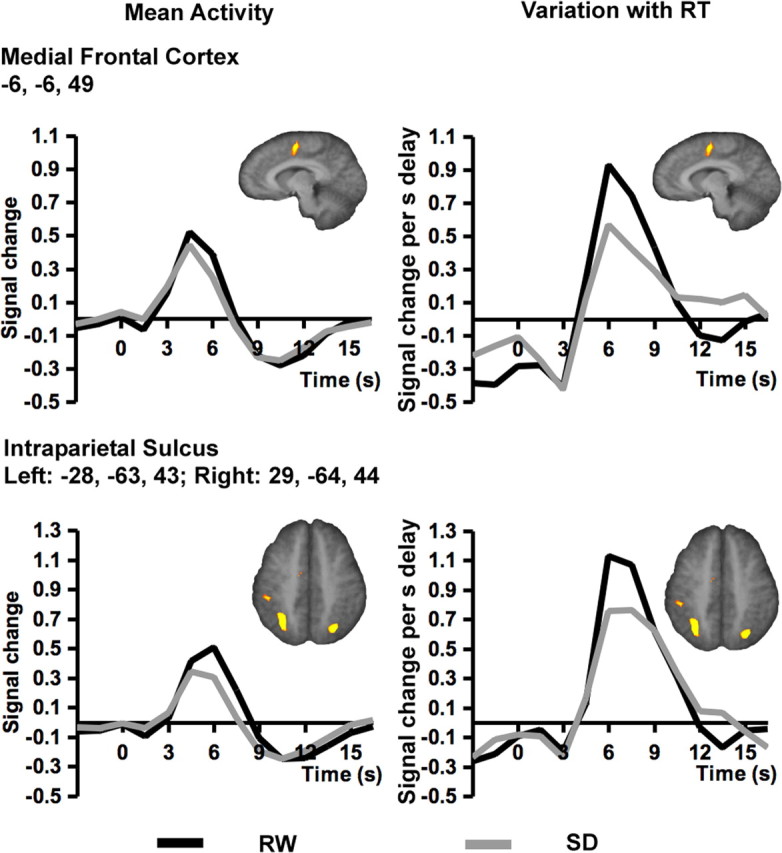
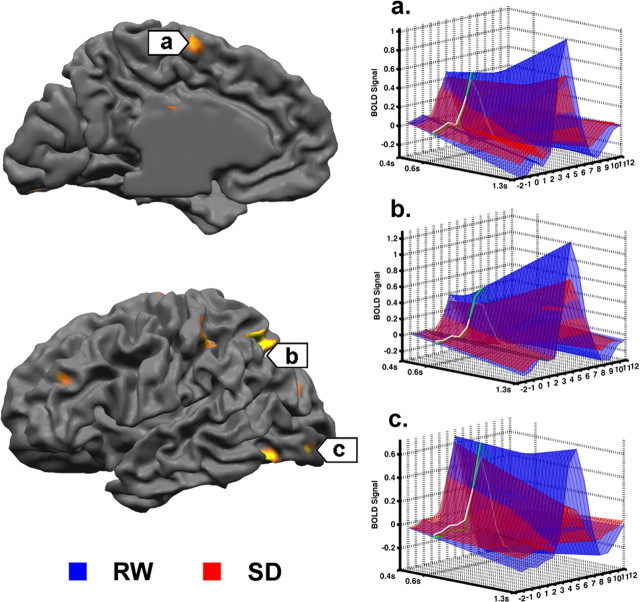
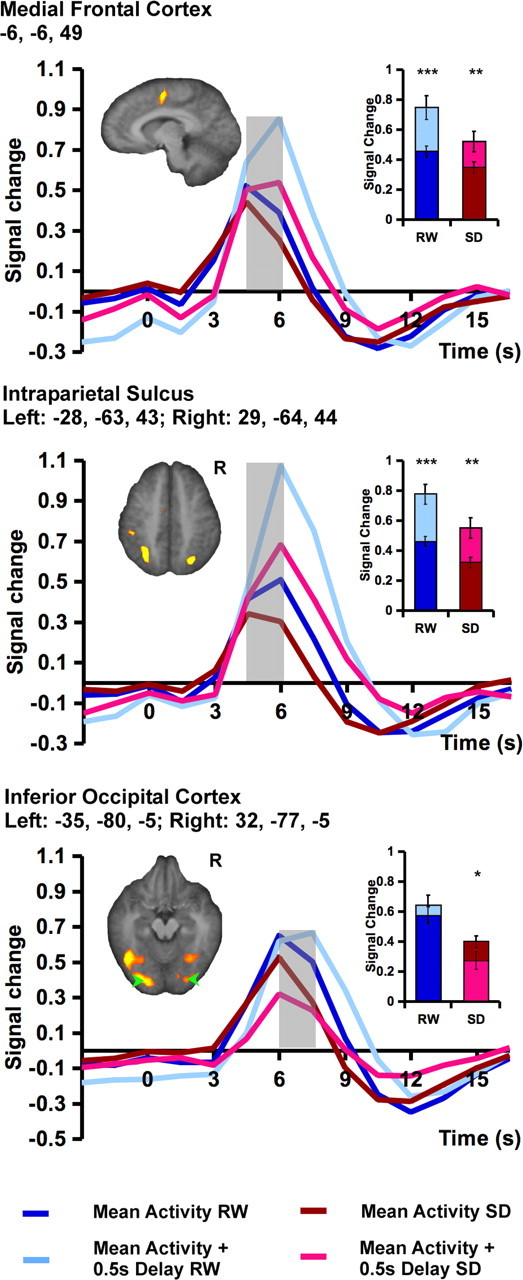
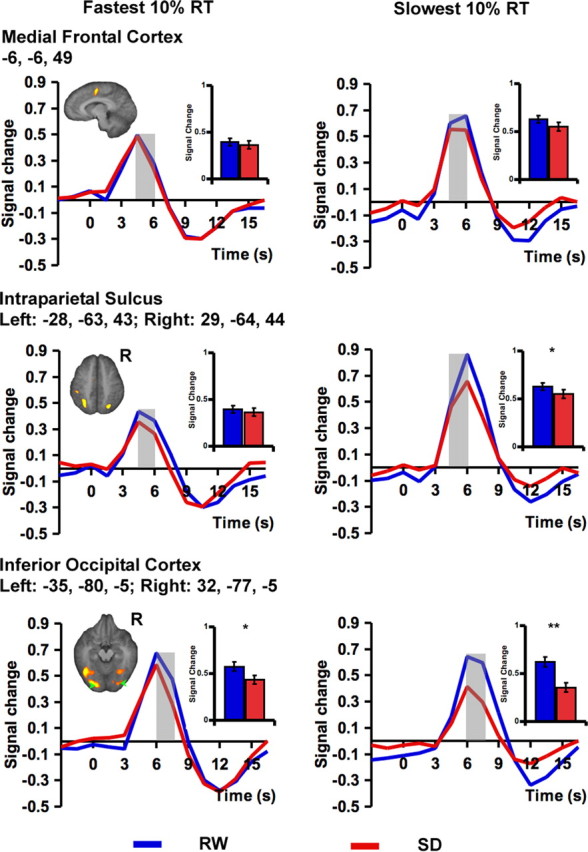
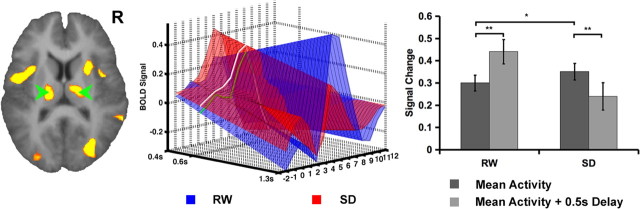
Lapses of attention manifest as delayed behavioral responses to salient stimuli. Although they can occur even after a normal night's sleep, they are longer in duration and more frequent after sleep deprivation (SD). To identify changes in task-associated brain activation associated with lapses during SD, we performed functional magnetic resonance imaging during a visual, selective attention task and analyzed the correct responses in a trial-by-trial manner modeling the effects of response time. Separately, we compared the fastest 10% and slowest 10% of correct responses in each state. Both analyses concurred in finding that SD-related lapses differ from lapses of equivalent duration after a normal night's sleep by (1) reduced ability of frontal and parietal control regions to raise activation in response to lapses, (2) dramatically reduced visual sensory cortex activation, and (3) reduced thalamic activation during lapses that contrasted with elevated thalamic activation during nonlapse periods. Despite these differences, the fastest responses after normal sleep and after SD elicited comparable frontoparietal activation, suggesting that performing a task while sleep deprived involves periods of apparently normal neural activation interleaved with periods of depressed cognitive control, visual perceptual functions, and arousal. These findings reveal for the first time some of the neural consequences of the interaction between efforts to maintain wakefulness and processes that initiate involuntary sleep in sleep-deprived persons.
Figures

Similar articles
-
Lapsing when sleep deprived: neural activation characteristics of resistant and vulnerable individuals.Neuroimage. 2010 Jun;51(2):835-43. doi: 10.1016/j.neuroimage.2010.02.031. Epub 2010 Feb 17. Neuroimage. 2010. PMID: 20171288
-
The neural bases of momentary lapses in attention.Nat Neurosci. 2006 Jul;9(7):971-8. doi: 10.1038/nn1727. Epub 2006 Jun 11. Nat Neurosci. 2006. PMID: 16767087
-
Sleep deprivation impairs object-selective attention: a view from the ventral visual cortex.PLoS One. 2010 Feb 5;5(2):e9087. doi: 10.1371/journal.pone.0009087. PLoS One. 2010. PMID: 20140099 Free PMC article. Clinical Trial.
-
A neural representation of categorization uncertainty in the human brain.Neuron. 2006 Mar 2;49(5):757-63. doi: 10.1016/j.neuron.2006.01.032. Neuron. 2006. PMID: 16504950
-
Time-on-task and sleep deprivation effects are evidenced in overlapping brain areas.Neuroimage. 2013 Nov 15;82:326-35. doi: 10.1016/j.neuroimage.2013.05.119. Epub 2013 Jun 6. Neuroimage. 2013. PMID: 23747456
Cited by
-
Time-varying coupling of EEG oscillations predicts excitability fluctuations in the primary motor cortex as reflected by motor evoked potentials amplitude: an EEG-TMS study.Hum Brain Mapp. 2014 May;35(5):1969-80. doi: 10.1002/hbm.22306. Epub 2013 Jul 19. Hum Brain Mapp. 2014. PMID: 23868714 Free PMC article.
-
Impact of Rapid Eye Movement Sleep Deprivation on Pain Behaviour and Oxidative Stress in the Thalamus: Role of Tualang Honey Supplementation.Malays J Med Sci. 2022 Apr;29(2):69-79. doi: 10.21315/mjms2022.29.2.7. Epub 2022 Apr 21. Malays J Med Sci. 2022. PMID: 35528807 Free PMC article.
-
Measurement of reaction time in the home for people with dementia: a feasibility study.Biol Res Nurs. 2013 Apr;15(2):179-84. doi: 10.1177/1099800411420862. Epub 2011 Oct 9. Biol Res Nurs. 2013. PMID: 21987831 Free PMC article.
-
Maximizing sensitivity of the psychomotor vigilance test (PVT) to sleep loss.Sleep. 2011 May 1;34(5):581-91. doi: 10.1093/sleep/34.5.581. Sleep. 2011. PMID: 21532951 Free PMC article.
-
Sleep loss produces false memories.PLoS One. 2008;3(10):e3512. doi: 10.1371/journal.pone.0003512. Epub 2008 Oct 23. PLoS One. 2008. PMID: 18946511 Free PMC article. Clinical Trial.
References
Publication types
MeSH terms
Substances
Grants and funding
LinkOut - more resources
Full Text Sources
Other Literature Sources