. 2008 May 27;105(21):7405-9.
doi: 10.1073/pnas.0710346105. Epub 2008 May 21.

Biochemical visualization of cell surface molecular clustering in living cells

Affiliations

Biochemical visualization of cell surface molecular clustering in living cells

Norihiro Kotani et al. Proc Natl Acad Sci U S A. .

Abstract

Many plasma membrane-resident molecules cluster with other molecules to collaborate in a variety of biological events. We herein report a sensitive and simple method to identify components of cell surface molecular clusters in living cells. This method includes a recently established reaction, called the enzyme-mediated activation of radical source (EMARS), to label molecules within a limited distance ( approximately 200-300 nm) from the probed molecule on which HRP is set. Because the size of this active area is close to that of the reported membrane clusters, it is suggested that the labeled molecules cluster with the probed molecule in the same membrane domain. A combination of the EMARS reaction and antibody array analysis demonstrated that many kinds of receptor tyrosine kinases (RTKs) formed clusters with beta1 integrin in HeLa S3 cells. A similar antibody array analysis after the EMARS reaction with three HRP-labeled antibodies against growth factor receptors showed the patterns of biotinylated RTKs to be substantially different from each other. These results suggest that different types of cell surface molecular clusters can thus be distinguished using the EMARS reaction. Therefore, the present "biochemical visualization" method is expected to be a powerful tool to elucidate molecular clustering on the cell surface of living cells in various contexts.


Conflict of interest statement

The authors declare no conflict of interest.

Figures
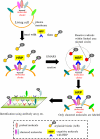
Fig. 1.
Fig. 1.
Schematic diagram of the in vivo EMARS analysis. Living cells were treated with HRP-conjugated cognitive molecules, and subsequently treated with aryl azide-biotin. After the EMARS reaction, the membrane proteins were solubilized and the biotinylated molecules were identified by using an antibody array etc.
Fig. 2.
Fig. 2.
The biotinylation of coclustered molecules with the probed molecule by the EMARS reaction. (A) The immunoelectron microscopic observation of biotinylated molecules and the probed molecule after the in vitro EMARS reaction. The EMARS reaction was performed in the presence (HRP+) or absence (HRP−) of HRP-conjugated anti-mouse IgG antibody on mouse serum-coated nickel grids. The biotinylated molecules were detected with 5-nm gold colloid-conjugated streptavidin (arrows) and the probed molecule, IgG was detected with 20-nm gold colloid-conjugated anti-mouse IgG antibody. (B) A quantitative analysis of the distance between the 5- and 20-nm gold particles (<400 nm) in the indicated samples. Forty-six and 41 20-nm particles were surveyed in HRP+ and HRP− samples, respectively. (C) The association of the biotinylated molecules with the probed molecule in a confocal laser scan microscopic observation. After the in vivo EMARS reaction in the HeLa S3 cells as described in the Materials and Methods, the probed molecule, β1-integrin was stained with Alexa488-conjugated anti-mouse IgG antibody (green), and the biotinylated molecules were detected with Alexa546-conjugated streptavidin (red). A merged image of both signals are shown in the image of “merge.” (D) The x-z scan images sectioned at the two indicated lines (sec.1 and sec. 2) in the “merge” image of D. The white line in each image indicates the basal surface.
Fig. 3.
Fig. 3.
Detection of known molecular assemblies on the plasma membranes by the EMARS reaction. (A) The biotinylation of EGFR by the EMARS reaction using anti-β1 integrin as a probe. HeLa S3 cells were successively subjected to the EMARS reaction using TS2/16 and HRP-conjugated second antibody, immunoprecipitated with an anti-EGFR antibody, 6% gel SDS/PAGE under a reducing condition, blotted to a PVDF membrane, and then stained for biotinylated proteins with an ABC kit (Left). After stripping, the membrane was restained with the indicated antibodies [EGFR (Center) and β1 integrin (Right)]. The open triangle (Left) indicates the band of biotinylated EGFR. The closed triangles (Left) indicate the bands of putative clustered molecules of β1 integrin. The arrow indicates the band of biotinylated β1 integrin. The upper band of EGFR (Center) is the complex-type N-glycosylated form (mainly located in the cell surface), and the lower is the high-mannose (hybrid)-type N-glycosylated form. Note that only the upper band was biotinylated (Left). (B) The streptoavidin precipitation assay of the EMARS products. The EMARS reaction was performed by using TS2/16 mouse monoclonal antibody and HRP-conjugated anti-mouse or anti-rabbit (negative control) IgG, and then applied to streptoavidin Sepharose. The precipitated samples were subsequently applied to Western blot analysis by using an anti-EGFR antibody. The open triangle indicates the bands of biotinylated EGFR. (C) The biotinylation of the T cell receptor (TCRαβ) by the EMARS reaction using the HRP-conjugated anti-CD3ε antibody, 500A2, as a probe. The 2C cells expressing clonotypic TCRαβ were successively subjected to the EMARS reaction using HRP-conjugated anti-CD3ε antibody, immunoprecipitated with a mixture of anti-TCRαβ and anti-CD3ε monoclonal antibody, 8% gel SDS/PAGE under nonreducing conditions, blotted to a PVDF membrane, and stained for biotinylated proteins with an ABC kit (Left). After stripping, the membrane was restained with the anti- TCRαβ antibodies (Right). The open triangle indicates the band of biotinylated TCRαβ. Asterisks indicate unknown bands derived from cellular component or used antibody. (D) HLA class I as a nonclustered molecule with integrin. For expression control, all cell-surface molecules were labeled by UV irradiation in the presence of arylazide-biotin as described in Materials and Methods. Samples of the EMARS reaction with [anti-β1 integrin (+)] or without [anti-β1 integrin (−)] TS2/16 antibody and the UV irradiation (ArB+UV) were applied to the streptoavidin-Sepharose. The precipitated samples were subjected to Western blot analysis by using anti-EGFR and anti-HLA class I antibodies.
Fig. 4.
Fig. 4.
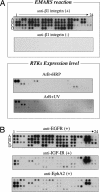
Biochemical visualization of coclustering between the cell surface molecules. (A and B) The biotinylated RTKs resulting from the EMARS reaction using TS2/16 anti-β1 integrin antibody (A) and anti-EGFR, IGF1R, and EphA2 antibodies (B) as a probe. The antibody array used in this study has 94 spots that contain antibodies against 42 kinds of RTKs (see Table S1) and control molecules with duplicates. After the EMARS reaction of the HeLa S3 cells using each antibody and HRP-conjugated second antibody [each antibody (+)], samples (TS2/16: 5 μg, anti-EGFR, IGF1R, and EphA2 antibody: 10 μg of total lysate proteins each) were reacted with an antibody array membrane. The control experiments were carried out without TS2/16 antibody [A, anti-β1 integrin antibody (−): 5 μg). The cell lysates after all cell-surface molecules labeling by a high dose of HRP and UV irradiation (see SI Materials and Methods) were also reacted with the antibody (A, ArB+HRP: 30 μg, ArB+UV: 20 μg).

References

    1. Jacobson K, Mouritsen OG, Anderson RG. Lipid rafts: at a crossroad between cell biology and physics. Nat Cell Biol. 2007;9:7–14. - PubMed
    1. Vereb G, et al. Dynamic, yet structured: The cell membrane three decades after the Singer-Nicolson model. Proc Natl Acad Sci USA. 2003;100:8053–8058. - PMC - PubMed
    1. Brown DA, London E. Functions of lipid rafts in biological membranes. Annu Rev Cell Dev Biol. 1998;14:111–136. - PubMed
    1. Douglass AD, Vale RD. Single-molecule microscopy reveals plasma membrane microdomains created by protein-protein networks that exclude or trap signaling molecules in T cells. Cell. 2005;121:937–950. - PMC - PubMed
    1. Simons K, Ikonen E. Functional rafts in cell membranes. Nature. 1997;387:569–572. - PubMed

Publication types