. 2008 Sep;19(9):1681-91.
doi: 10.1681/ASN.2007101099. Epub 2008 May 21.

Heme oxygenase-1 deficiency promotes epithelial-mesenchymal transition and renal fibrosis

Affiliations

Heme oxygenase-1 deficiency promotes epithelial-mesenchymal transition and renal fibrosis

Jeong-Hae Kie et al. J Am Soc Nephrol. 2008 Sep.

Abstract

Induction of heme oxygenase-1 (HO-1) is associated with potential antifibrogenic effects. The effects of HO-1 expression on epithelial-mesenchymal transition (EMT), which plays a critical role in the development of renal fibrosis, are unknown. In this study, HO-1(-/-) mice demonstrated significantly more fibrosis after 7 d of unilateral ureteral obstruction compared with wild-type mice, despite similar degrees of hydronephrosis. The obstructed kidneys of HO-1(-/-) mice also had greater macrophage infiltration and renal tubular TGF-beta1 expression than wild-type mice. In addition, the degree of EMT was more extensive in obstructed HO-1(-/-) kidneys, as assessed by alpha-smooth muscle actin and expression of S100A4 in proximal tubular epithelial cells. In vitro studies using proximal tubular cells isolated from HO-1(-/-) and wild-type kidneys confirmed these observations. In conclusion, HO-1 deficiency is associated with increased fibrosis, tubular TGF-beta1 expression, inflammation, and enhanced EMT in obstructive kidney disease. Modulation of the HO-1 pathway may provide a new therapeutic approach to progressive renal diseases.


Figures

Figure 1.
Figure 1.
Histologic changes of cortex and medulla in the kidneys of HO-1+/+ and HO-1−/− mice. Representative hematoxylin and eosin staining of renal cortex and medulla sections from sham-operated (Sham) mice, as well as sections from obstructed (UUO) and CL kidneys of both HO-1+/+ (left) and HO-1−/− (right) mice on day 7. The CL kidney of HO-1−/− mouse, one of three cases showing histologic changes (shown), has increased interstitial fibrosis compared with normal appearances of sham-operated kidneys of both groups and the CL kidney of HO-1+/+ mouse. HO-1+/+ sham (n = 3), HO-1−/− sham (n = 3), HO-1+/+ CL and UUO (n = 9), and HO-1−/− CL and UUO kidneys (n = 7). Bar = 100 μm.
Figure 2.
Figure 2.
Higher magnification showing the degree of fibrosis in the obstructed kidneys of HO-1+/+ and HO-1−/− mice. (A) Wedge-shaped area selected for analysis is shown. The green box represents the ×100 light microscopic field used to cover most of the wedge-shaped area including cortex and partial medulla along the papillary axis. (B) Representative Masson's trichrome stained sections of the renal cortex and partial medulla from sham-operated (Sham; top) mice, as well as sections from obstructed (UUO; bottom) and CL (middle) kidneys of both HO-1+/+ (left) and HO-1−/− (right) mice on day 7. Bar = 100 μm. CMJ, corticomedullary junction. (C) Graph of fibrotic area identified by color image analyzer. HO-1+/+ sham (n = 3); HO-1−/− sham (n = 3); HO-1+/+ CL and UUO (n = 9); HO-1−/− CL and UUO kidneys (n = 7). *P < 0.05 versus all other groups. (D) Representative western blot analysis (top) for Fn protein of kidney lysates was performed as described in the Concise Methods section. HO-1+/+ sham (n = 3); HO-1−/− sham (n = 3); HO-1+/+ CL and UUO (n = 7); HO-1−/− CL and UUO kidneys (n = 4). The densitometry of Fn was normalized to β-actin and graphed (bottom). *P < 0.05 versus all other groups. Magnification, ×100.
Figure 3.
Figure 3.
F4/80+ cells in HO-1+/+ compared with HO-1−/− mice. (A) Representative F4/80-stained sections from sham-operated (Sham) mice, as well as sections from obstructed (UUO) and CL kidneys of both HO-1+/+ (left) and HO-1−/− (right) mice on day 7. A CL kidney of HO-1−/− showing higher numbers of recruited macrophages compared with the CL kidney of HO-1+/+ mouse is shown. Bar = 100 μm. (B) The graph represents the total F4/80-positive cells counted from five contiguous HPF (×400) per kidney section as described in the Concise Methods section. HO-1+/+ sham (n = 3); HO-1−/− sham (n = 3); HO-1+/+ CL and UUO (n = 9); HO-1−/− CL and UUO kidneys (n = 7). *P < 0.05 versus all other groups.
Figure 4.
Figure 4.
Comparison of TGF-β1 expression in the kidneys of HO-1+/+ and HO-1−/− mice. (A) Representative immunohistochemical staining for TGF-β1 from sham-operated (Sham) mice, as well as sections from obstructed (UUO) and CL kidneys of both HO-1+/+ (left) and HO-1−/− (right) mice on day 7. The representative CL kidney of HO-1−/− mouse (one of three cases showing histologic changes and increased TGF-β1 expression, compared with the sham kidney) is shown. Bar = 100 μm. (B) TGF-β1–expressing areas were counted by a color image analyzer as a proportion of positively stained area to the total cross-sectional area of renal tubules selected along the basement membrane in each HPF. First, renal tubules are identified by color image analyzer (left) followed by identification of TGF-β1–expressing areas within the tubules (right). Bar = 20 μm. (C) Graphic representation of mean proportion (%) of TGF-β1–expressing area in the renal tubule of five HPF (×400) per kidney section. *P < 0.05 versus obstructed kidney of HO-1+/+ mice; †P < 0.005 versus the CL kidney of HO-1+/+ mice. (D) Correlation graphs of renal tubular–TGF-β1 expression versus the degree of the fibrosis in renal sections from sham-operated (Sham; circles) mice, as well as sections from obstructed (UUO; squares) and CL (triangles) kidneys of both HO-1+/+ (closed symbols) and HO-1−/− (open symbols) mice on day 7. r = 0.8265, r2 = 0.6831; r is significantly different from zero with the two-tailed P < 0.0001. HO-1+/+ sham (n = 3); HO-1−/− sham (n = 3); HO-1+/+ CL and UUO (n = 9); HO-1−/− CL and UUO kidneys (n = 7).
Figure 5.
Figure 5.
Comparison of α-SMA expression in the kidneys of HO-1+/+ and HO-1−/− mice. Representative immunohistochemical staining for α-SMA from obstructed (UUO) and CL kidneys of both HO-1+/+ (left) and HO-1−/− (right) mice on day 7. Bar = 100 μm. HO-1+/+ CL and UUO (n = 3); HO-1−/− CL and UUO kidneys (n = 3). (Inset) Higher magnification image of a renal tubule with positive staining for α-SMA in an obstructed HO-1−/− kidney.
Figure 6.
Figure 6.
EMT in obstructed kidneys of HO-1+/+ and HO-1−/− mice. (A) Representative double immunohistochemical staining using S100A4 (purple) and lotus lectin (gray blue) from obstructed (UUO) and CL kidneys of both HO-1+/+ (left) and HO-1−/− (right) mice on day 7. Bar = 20 μm. (B) S100A4-expressing proximal tubules are counted by identifying renal tubules (lotus lectin) by color image analyzer (left) followed by identification of S100A4-expressing areas within the tubules (right). Bar = 20 μm. (C) Graph of proximal tubules expressing S100A4 in five HPF (×400) per kidney section from sham-operated (Sham) mice, as well as from obstructed (UUO) and CL kidneys of both HO-1+/+ (left) and HO-1−/− (right) mice. *P < 0.05 versus all other groups. (D) Correlation graph of proximal tubular expression of S100A4 (EMT) versus the degree of the fibrosis in kidneys from sham-operated (Sham; circles) mice, as well as sections from obstructed (UUO; squares) and CL (triangles) kidneys of both HO-1+/+ (closed symbols) and HO-1−/− (open symbols) mice on day 7. r = 0.7761, (95% confidence interval 0.6070 to 0.8780), r2 = 0.6024; r is significantly different from zero with the two-tailed P < 0.0001. (E) Correlation graph of proximal tubular expression of S100A4 (EMT) versus the renal tubular expression of TGF-β1 in kidneys from sham-operated (Sham; circles) mice, as well as sections from obstructed (UUO; squares) and CL (triangles) kidneys of both HO-1+/+ (closed symbols) and HO-1−/− (open symbols) mice on day 7. r = 0.8308 (95% confidence interval 0.6959 to 0.9091), r2 = 0.6902; r is significantly different from zero with the two-tailed P < 0.0001. HO-1+/+ sham (n = 3); HO-1−/− sham (n = 3); HO-1+/+ CL and UUO (n = 9); HO-1−/− CL and UUO kidneys (n = 7).
Figure 7.
Figure 7.
Characterization of primary proximal tubular epithelial cell cultures derived from HO-1+/+ and HO-1−/− mice. (A) Staining of HO-1+/+ and HO-1−/− primary proximal tubular epithelial cell cultures demonstrating expression of proximal tubular epithelial cell markers, γ-glutamyltranspeptidase (GGT) and alkaline phosphatase (Alk Phos). (B) Phase-contrast images of HO-1+/+ and HO-1−/− proximal tubular epithelial cell cultures showing domes in confluent cells (0 h, vehicle treated) of each genotype and phenotypic changes in response to TGF-β1 (5 ng/ml) with time, as indicated. (C) Immunoblot from cell lysates from HO-1+/+ and HO-1−/− proximal tubular epithelial cell cultures treated with vehicle (0 h) or TGF-β1 (5 ng/ml) for the times indicated. Blots were stripped and reprobed for β-actin to confirm loading and transfer. Representative of n = 4 independent cell cultures from separate mice/genotype.
Figure 8.
Figure 8.
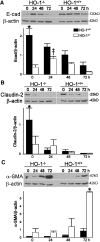
EMT in HO-1+/+ and HO-1−/− primary proximal tubular epithelial cell cultures. Immunoblot analysis of cell lysates from HO-1+/+ and HO-1−/− primary proximal tubular epithelial cell cultures treated with vehicle (0 h) or TGF-β1 (5 ng/ml) for the times indicated. The blots were stripped and reprobed for β-actin to confirm loading and transfer. (A) E-cadherin (E-cad) immunoblot (top) and densitometry of E-cad/β-actin (arbitrary units; bottom). (B) Claudin-2 (top) and densitometry of claudin-2/β-actin (arbitrary units; bottom). (C) α-SMA (top) and densitometry of α-SMA/β-actin (arbitrary units; bottom). *P < 0.05 versus all other groups; ‡P < 0.05 versus HO-1+/+. Densitometry derived from n = 4 independent experiments from cell cultures from separate mice/genotype.

Similar articles

Cited by

References

    1. Klahr S, Morrissey J: Obstructive nephropathy and renal fibrosis. Am J Physiol Renal Physiol 283: F861–F875, 2002 - PubMed
    1. Bascands JL, Schanstra JP: Obstructive nephropathy: Insights from genetically engineered animals. Kidney Int 68: 925–937, 2005 - PMC - PubMed
    1. Yang SP, Woolf AS, Quinn F, Winyard PJ: Deregulation of renal transforming growth factor-beta1 after experimental short-term ureteric obstruction in fetal sheep. Am J Pathol 159: 109–117, 2001 - PMC - PubMed
    1. Docherty NG, O’Sullivan OE, Healy DA, Murphy M, O’Neill AJ, Fitzpatrick JM, Watson RW: TGF-β1 induced EMT can occur independently of its pro-apoptotic effects and is aided by EGF receptor activation. Am J Physiol Renal Physiol 290: F1202–F1212, 2006 - PubMed
    1. Yang J, Liu Y: Dissection of key events in tubular epithelial to myofibroblast transition and its implications in renal interstitial fibrosis. Am J Pathol 159: 1465–1475, 2001 - PMC - PubMed

Publication types