

Statistical mixture modeling for cell subtype identification in flow cytometry
- PMID: 18496851
- PMCID: PMC2840702
- DOI: 10.1002/cyto.a.20583
Statistical mixture modeling for cell subtype identification in flow cytometry
Abstract
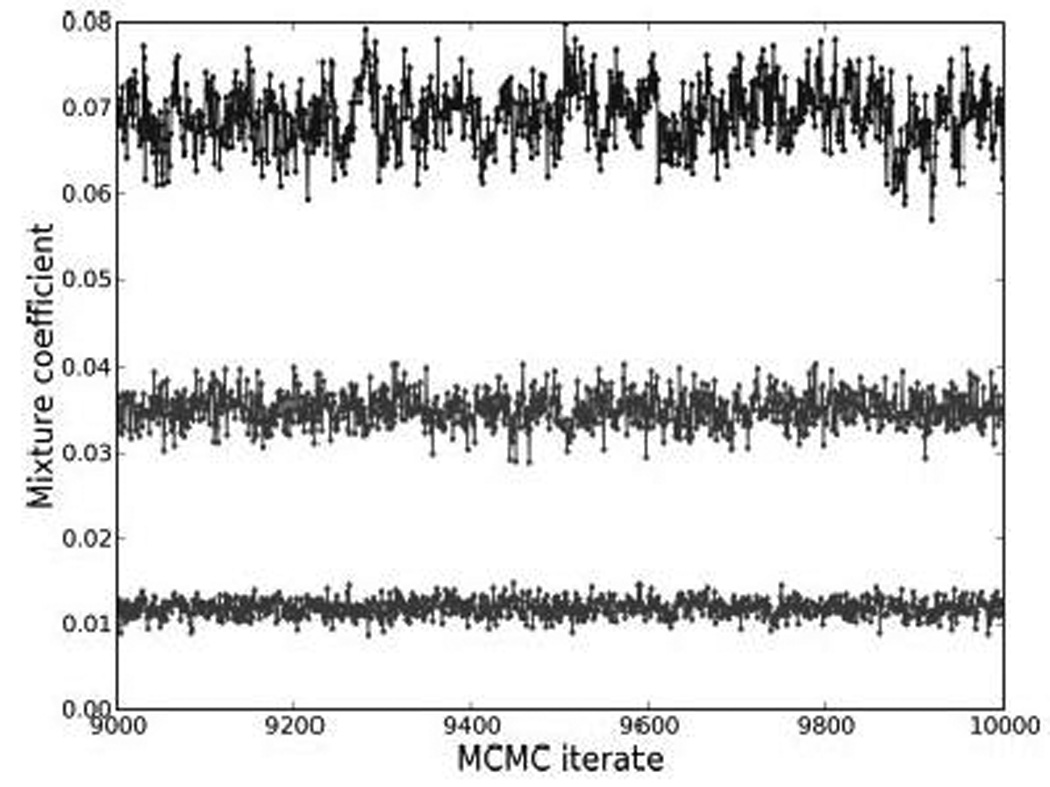
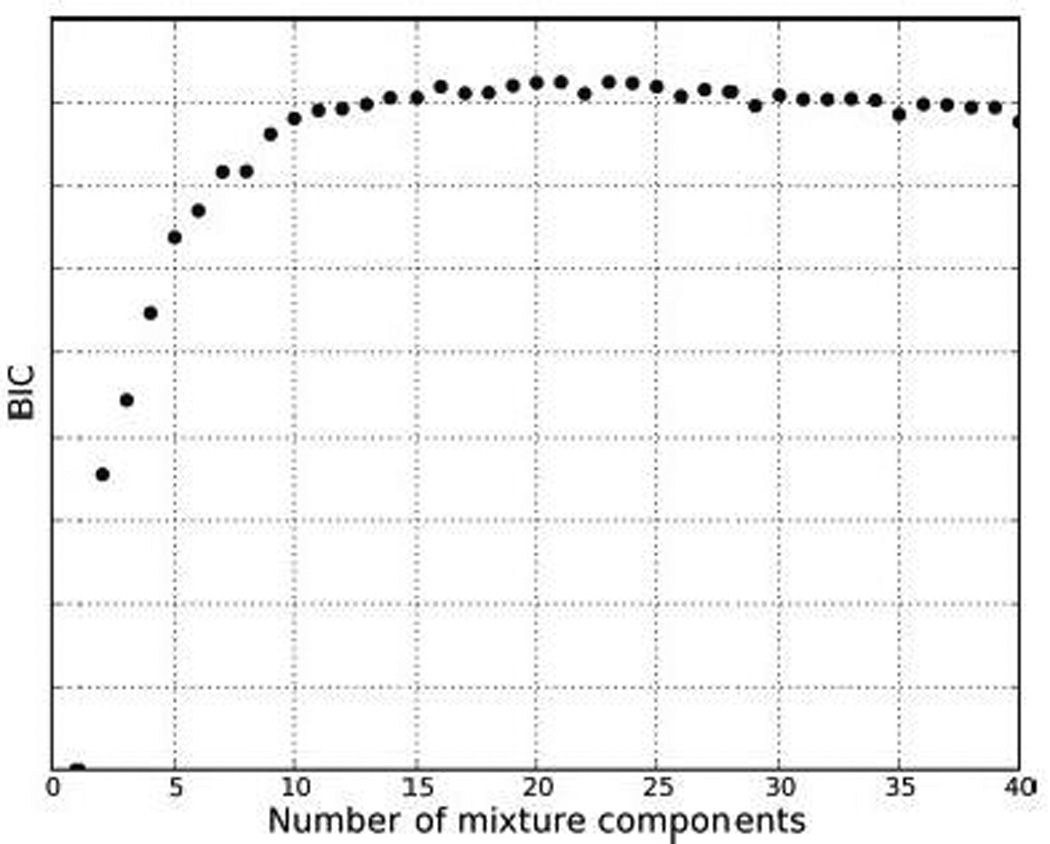
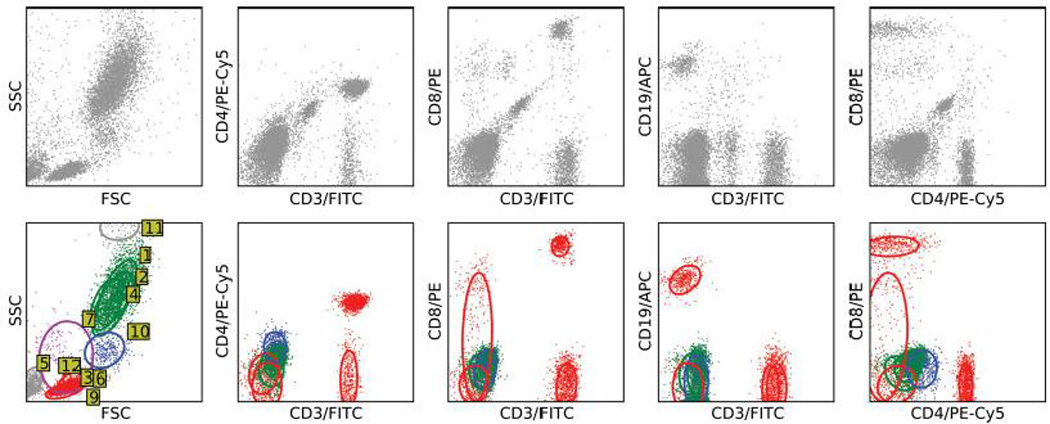
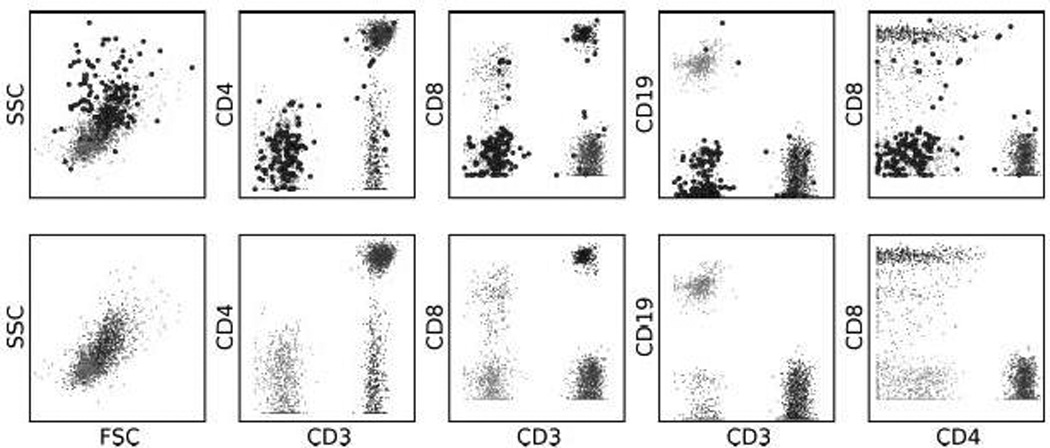
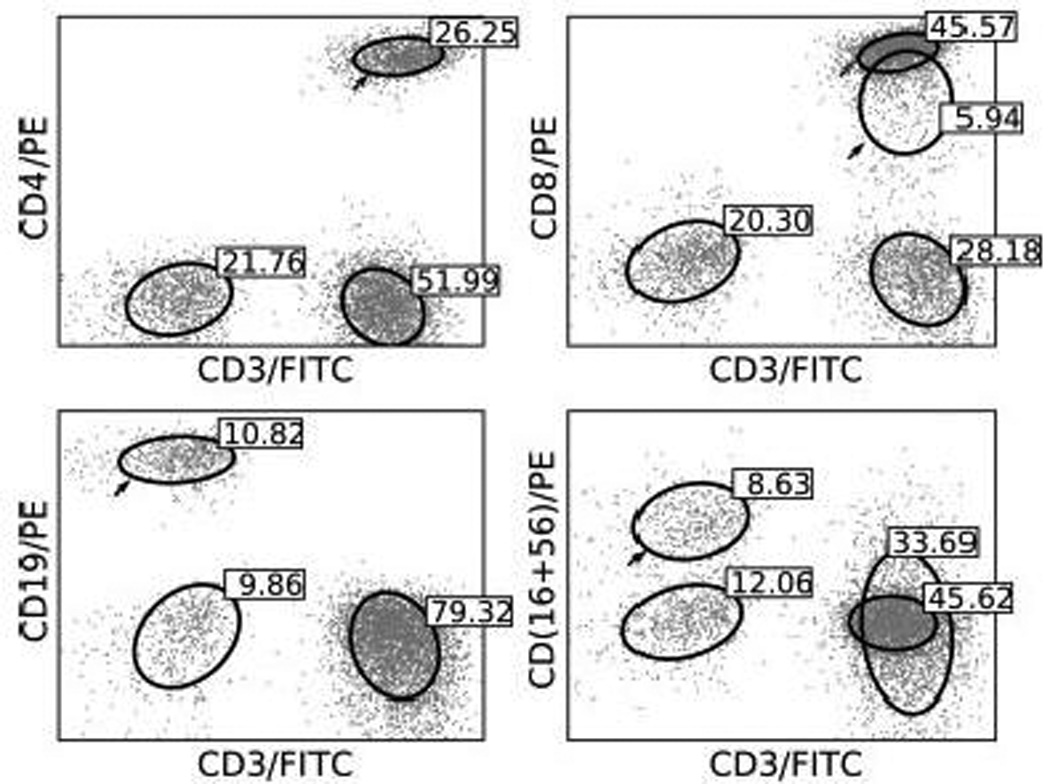
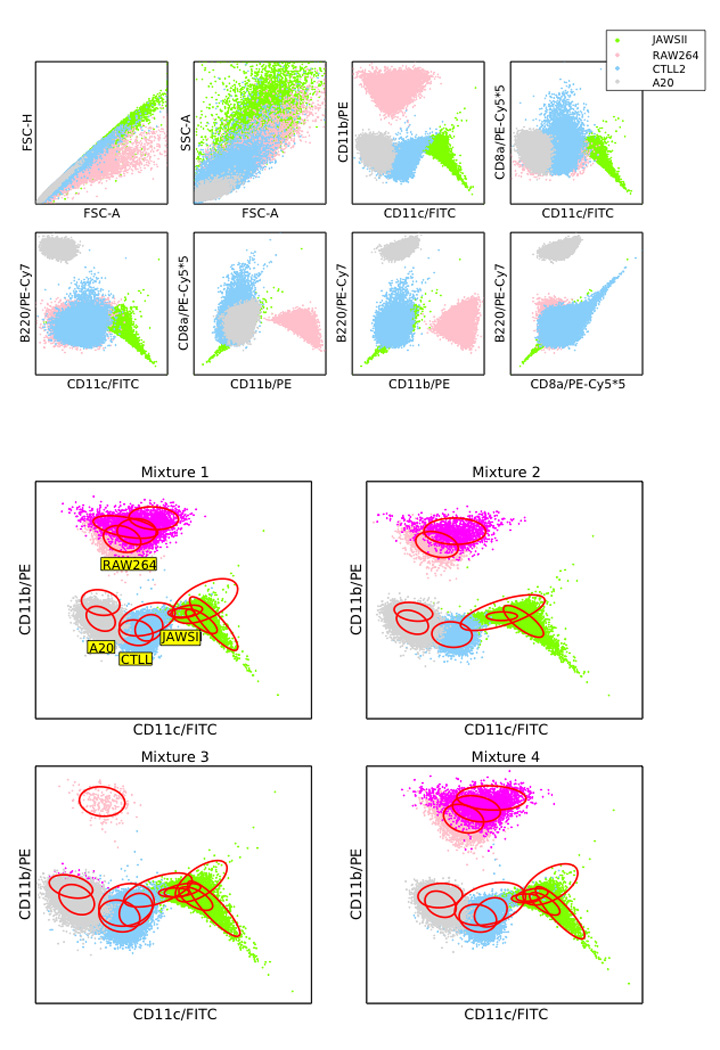
Statistical mixture modeling provides an opportunity for automated identification and resolution of cell subtypes in flow cytometric data. The configuration of cells as represented by multiple markers simultaneously can be modeled arbitrarily well as a mixture of Gaussian distributions in the dimension of the number of markers. Cellular subtypes may be related to one or multiple components of such mixtures, and fitted mixture models can be evaluated in the full set of markers as an alternative, or adjunct, to traditional subjective gating methods that rely on choosing one or two dimensions. Four color flow data from human blood cells labeled with FITC-conjugated anti-CD3, PE-conjugated anti-CD8, PE-Cy5-conjugated anti-CD4, and APC-conjugated anti-CD19 Abs was acquired on a FACSCalibur. Cells from four murine cell lines, JAWS II, RAW 264.7, CTLL-2, and A20, were also stained with FITC-conjugated anti-CD11c, PE-conjugated anti-CD11b, PE-Cy5-conjugated anti-CD8a, and PE-Cy7-conjugated-CD45R/B220 Abs, respectively, and single color flow data were collected on an LSRII. The data were fitted with a mixture of multivariate Gaussians using standard Bayesian statistical approaches and Markov chain Monte Carlo computations. Statistical mixture models were able to identify and purify major cell subsets in human peripheral blood, using an automated process that can be generalized to an arbitrary number of markers. Validation against both traditional expert gating and synthetic mixtures of murine cell lines with known mixing proportions was also performed. This article describes the studies of statistical mixture modeling of flow cytometric data, and demonstrates their utility in examples with four-color flow data from human peripheral blood samples and synthetic mixtures of murine cell lines.
(c) 2008 International Society for Advancement of Cytometry
Figures
References
-
- Cormack RM. A Review of Classification. Journal of the Royal Statistical Society. Series A (General) 1971;134:321–367.
-
- Tarnok A. A focus on automated recognition. Cytometry A. 2007;71(10):769–770. - PubMed
-
- Robert CP. Mixtures of distributions: Inference and estimation. Markov Chain Monte Carlo in Practice. 1996:441–464.
-
- Titterington D, Smith AFM, Makov U. Statistical Analysis of Finite Mixture Distributions. John Wiley & Sons; 1985.
Publication types
MeSH terms
Grants and funding
LinkOut - more resources
Full Text Sources
Other Literature Sources
Research Materials
