

Extracellular matrix protein-coated scaffolds promote the reversal of diabetes after extrahepatic islet transplantation
- PMID: 18497687
- PMCID: PMC2597660
- DOI: 10.1097/TP.0b013e31816fc0ea
Extracellular matrix protein-coated scaffolds promote the reversal of diabetes after extrahepatic islet transplantation
Abstract
Background: The survival and function of transplanted pancreatic islets is limited, owing in part to disruption of islet-matrix attachments during the isolation procedure. Using polymer scaffolds as a platform for islet transplantation, we investigated the hypothesis that replacement of key extracellular matrix components known to surround islets in vivo would improve graft function at an extrahepatic implantation site.
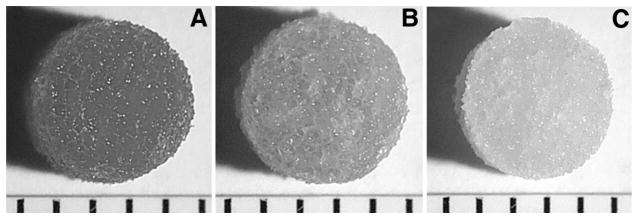
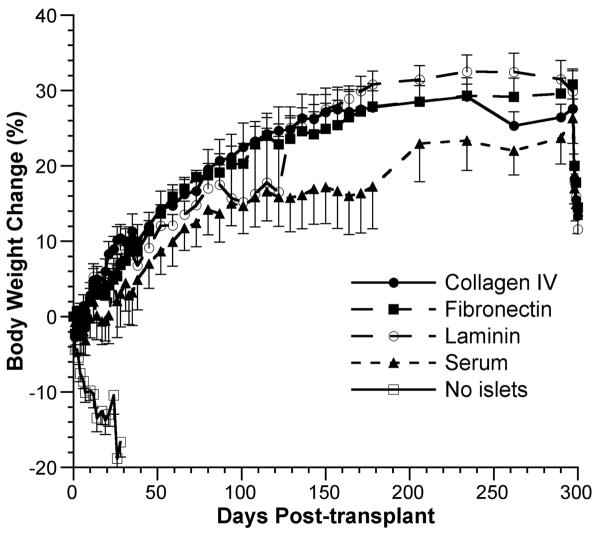
Methods: Microporous polymer scaffolds fabricated from copolymers of lactide and glycolide were adsorbed with collagen IV, fibronectin, laminin-332 or serum proteins before seeding with 125 mouse islets. Islet-seeded scaffolds were then implanted onto the epididymal fat pad of syngeneic mice with streptozotocin-induced diabetes. Nonfasting glucose levels, weight gain, response to glucose challenges, and histology were used to assess graft function for 10 months after transplantation.
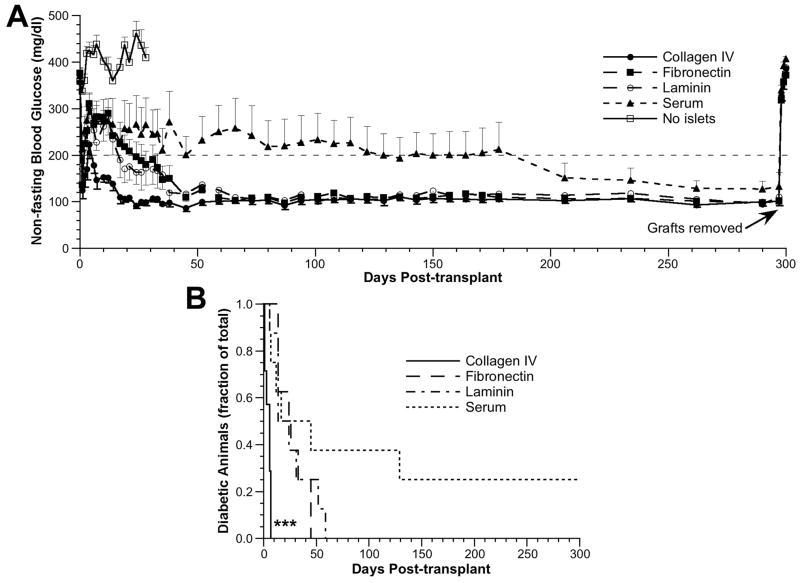
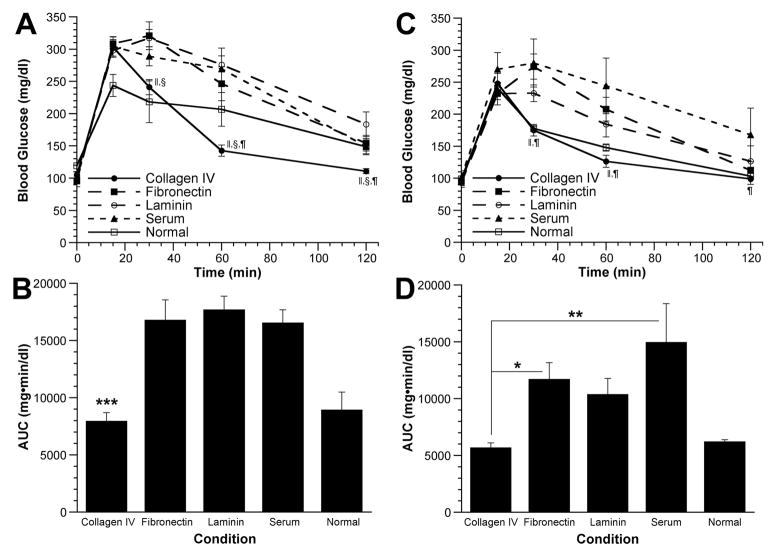
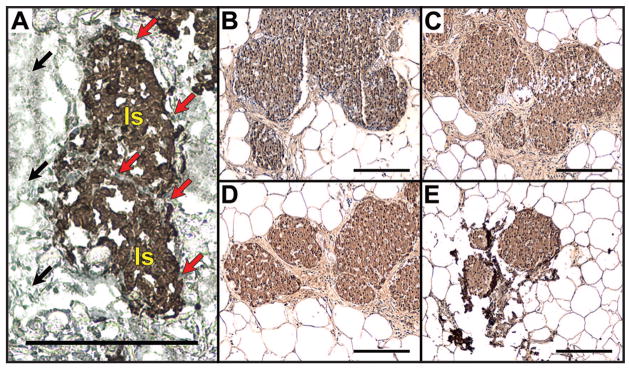
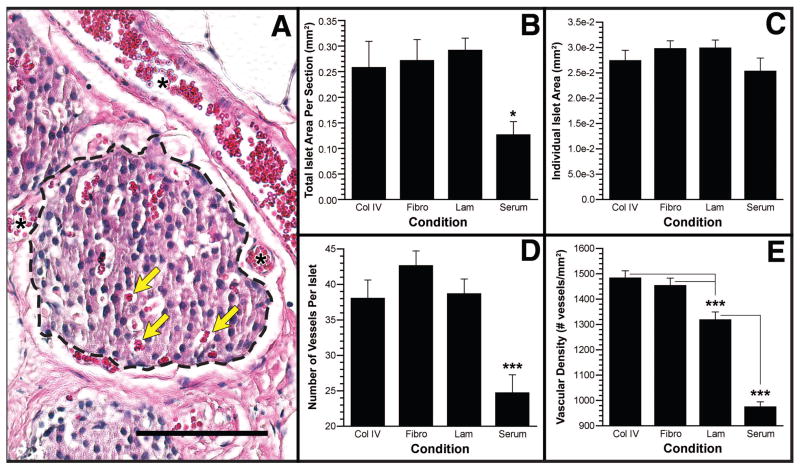
Results: Mice transplanted with islets seeded onto scaffolds adsorbed with collagen IV achieved euglycemia fastest and their response to glucose challenge was similar to normal mice. Fibronectin and laminin similarly promoted euglycemia, yet required more time than collagen IV and less time than serum. Histopathological assessment of retrieved grafts demonstrated that coating scaffolds with specific extracellular matrix proteins increased total islet area in the sections and vessel density within the transplanted islets, relative to controls.
Conclusions: Extracellular matrix proteins adsorbed to microporous scaffolds can enhance the function of transplanted islets, with collagen IV maximizing graft function relative to the other proteins tested. These scaffolds enable the creation of well-defined microenvironments that promote graft efficacy at extrahepatic sites.
Figures
Similar articles
-
Polymer scaffolds as synthetic microenvironments for extrahepatic islet transplantation.Transplantation. 2006 Aug 27;82(4):452-9. doi: 10.1097/01.tp.0000231708.19937.21. Transplantation. 2006. PMID: 16926587 Free PMC article.
-
Micro-fabricated scaffolds lead to efficient remission of diabetes in mice.Biomaterials. 2017 Aug;135:10-22. doi: 10.1016/j.biomaterials.2017.03.031. Epub 2017 Mar 27. Biomaterials. 2017. PMID: 28478326
-
Development of an ectopic site for islet transplantation, using biodegradable scaffolds.Tissue Eng. 2005 Sep-Oct;11(9-10):1323-31. doi: 10.1089/ten.2005.11.1323. Tissue Eng. 2005. PMID: 16259588
-
Lung-Derived Microscaffolds Facilitate Diabetes Reversal after Mouse and Human Intraperitoneal Islet Transplantation.PLoS One. 2016 May 26;11(5):e0156053. doi: 10.1371/journal.pone.0156053. eCollection 2016. PLoS One. 2016. PMID: 27227978 Free PMC article.
-
Polymer scaffolds for pancreatic islet transplantation - Progress and challenges.Am J Transplant. 2018 Sep;18(9):2113-2119. doi: 10.1111/ajt.14942. Epub 2018 Jun 13. Am J Transplant. 2018. PMID: 29790274 Review.
Cited by
-
Microwell scaffolds for the extrahepatic transplantation of islets of Langerhans.PLoS One. 2013 May 30;8(5):e64772. doi: 10.1371/journal.pone.0064772. Print 2013. PLoS One. 2013. PMID: 23737999 Free PMC article.
-
Regenerative Medicine and Diabetes: Targeting the Extracellular Matrix Beyond the Stem Cell Approach and Encapsulation Technology.Front Endocrinol (Lausanne). 2018 Aug 31;9:445. doi: 10.3389/fendo.2018.00445. eCollection 2018. Front Endocrinol (Lausanne). 2018. PMID: 30233489 Free PMC article. Review.
-
Protein-mediated interactions of pancreatic islet cells.Scientifica (Cairo). 2013;2013:621249. doi: 10.1155/2013/621249. Epub 2013 Jan 8. Scientifica (Cairo). 2013. PMID: 24278783 Free PMC article. Review.
-
Tissue Engineering Approaches in the Design of Healthy and Pathological In Vitro Tissue Models.Front Bioeng Biotechnol. 2017 Jul 26;5:40. doi: 10.3389/fbioe.2017.00040. eCollection 2017. Front Bioeng Biotechnol. 2017. PMID: 28798911 Free PMC article. Review.
-
Hydrogels to modulate lentivirus delivery in vivo from microporous tissue engineering scaffolds.Drug Deliv Transl Res. 2011 Feb 1;1(1):91-101. doi: 10.1007/s13346-010-0011-1. Drug Deliv Transl Res. 2011. PMID: 22229129 Free PMC article.
References
-
- Eiselein L, Schwartz HJ, Rutledge JC. The challenge of type 1 diabetes mellitus. ILAR J. 2004;45:231. - PubMed
-
- Eisenbarth GS. Type I diabetes mellitus. A chronic autoimmune disease. N Engl J Med. 1986;314:1360. - PubMed
-
- Hamalainen AM, Knip M. Autoimmunity and familial risk of type 1 diabetes. Curr Diab Rep. 2002;2:347. - PubMed
-
- Yoon JW, Jun HS. Autoimmune destruction of pancreatic Beta cells. Am J Ther. 2005;12:580. - PubMed
-
- Wilson DB. Immunology: Insulin auto-antigenicity in type 1 diabetes. Nature. 2005;438:E5. - PubMed
Publication types
MeSH terms
Substances
Grants and funding
LinkOut - more resources
Full Text Sources
Other Literature Sources
Medical
