. 2008 May 22;453(7194):475-80.
doi: 10.1038/nature06952.

Mechanism of shape determination in motile cells

Affiliations

Mechanism of shape determination in motile cells

Kinneret Keren et al. Nature. .

Abstract

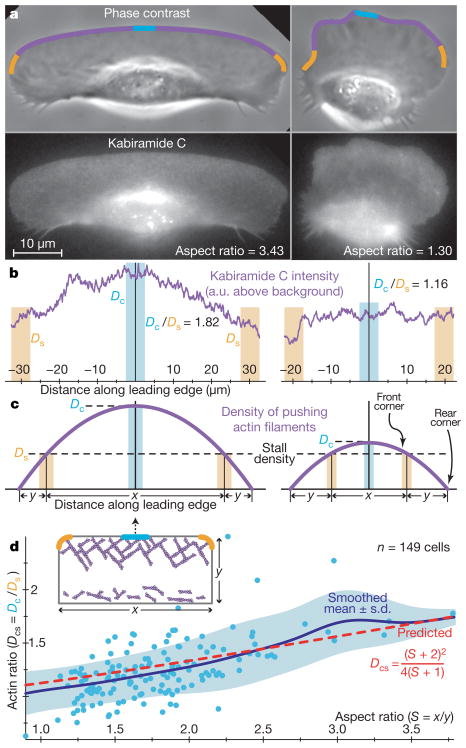
The shape of motile cells is determined by many dynamic processes spanning several orders of magnitude in space and time, from local polymerization of actin monomers at subsecond timescales to global, cell-scale geometry that may persist for hours. Understanding the mechanism of shape determination in cells has proved to be extremely challenging due to the numerous components involved and the complexity of their interactions. Here we harness the natural phenotypic variability in a large population of motile epithelial keratocytes from fish (Hypsophrys nicaraguensis) to reveal mechanisms of shape determination. We find that the cells inhabit a low-dimensional, highly correlated spectrum of possible functional states. We further show that a model of actin network treadmilling in an inextensible membrane bag can quantitatively recapitulate this spectrum and predict both cell shape and speed. Our model provides a simple biochemical and biophysical basis for the observed morphology and behaviour of motile cells.


Figures

Figure 1
Figure 1. Keratocyte shapes are described by four primary shape modes
a, Phase-contrast images of different live keratocytes illustrate the natural shape variation in the population. b, The first four principal modes of keratocyte shape variation, as determined by principal components analysis of 710 aligned outlines of live keratocytes, are shown. These modes—cell area (shape mode 1), ‘D’ versus ‘canoe’ shape (shape mode 2), cell-body position (shape mode 3), and left–right asymmetry (shape mode 4)—are highly reproducible; subsequent modes seem to be noise. For each mode, the mean cell shape is shown alongside reconstructions of shapes one and two standard deviations away from the mean in each direction along the given mode. The variation accounted for by each mode is indicated. (Modes one and two are scaled as in a; modes three and four are 50% smaller.)
Figure 2
Figure 2. Quantitative and correlative analysis of keratocyte morphology and speed
a, The distributions of measures across a population of live keratocytes (left panels) are contrasted with values through time for 11 individual cells (right). Within each histogram, the population mean ± one standard deviation is shown by the left vertical bar, whereas the population mean ± the average standard deviation exhibited by individual cells over 5 min is shown by the right bar. b, Significant pair-wise correlations (P <0.05; bootstrap confidence intervals) within a population of keratocytes are diagrammed (left panel). Two additional measures are included: front roughness, which measures the local irregularity of the leading edge, and actin ratio, which represents the peakedness of the actin distribution along the leading edge. The correlations indicate that, apart from size differences, cells lie along a single phenotypic continuum (right panel), from ‘decoherent’ to ‘coherent’. Decoherent cells move slowly and assume rounded shapes with low aspect ratios and high lamellipodial curvatures. The actin network is less ordered, with ragged leading edges and low actin ratios. Coherent cells move faster and have lower lamellipodial curvature. The actin network is highly ordered with smooth leading edges and high actin ratios. c, Phase-contrast images depict a cell transiently treated with DMSO (Supplementary Movie 1), which caused a reversible inhibition of motility and loss of the lamellipodium. Images shown correspond to before (20 s), during (610 s) and two time points after (830 s and 1,230 s) the perturbation. d, Time traces of area, aspect ratio and speed for the cell in c show that shape and speed are regained post perturbation. Dashed lines show time points from c; arrowheads indicate the time of perturbation. e, Area, aspect ratio and speed of nine cells are shown as averages obtained from one-minute windows before, during and after DMSO treatment (shown sequentially from left to right for each cell). The cell shown in c and d is highlighted.
Figure 3
Figure 3. A quantitative model explains the main features of keratocyte shapes
a, Phase-contrast (top) and fluorescence (bottom) images are shown for two live keratocytes stained with TMR-derivatized kabiramide C. The fluorescence intensity reflects the current and past distribution of filament ends, in addition to diffuse background signal from unincorporated probe. Along the leading edge, the fluorescence intensity is proportional to the local density of actin filaments (see Supplementary Information; 1-μm-wide strips along the leading edge are shown superimposed on the phase-contrast images, with centre and side regions highlighted). b, The average (background-corrected) fluorescence intensity along the strips shown in a is plotted. The cell on the left has a peaked distribution of actin filaments, whereas the actin distribution in the cell on the right is flatter. The ratio of the actin density at the centre (Dc) and sides (Ds; averaged over both sides) of the strip, denoted as Dcs, serves as a robust measure of the peakedness of the distribution. c, The density distribution of pushing actin filaments along the leading edge is approximated as a parabola, with a maximum at the centre. Cells with peaked filamentous actin distributions and, therefore, high Dcs values, have larger regions in which the actin filament density is above the ‘stall’ threshold, and thus have longer protruding front edges (of length x) compared with the length of the stalled/retracting cell sides (y), yielding higher aspect ratios (S =x/y). d, The ratio between actin density at the centre and at the sides, Dcs, is plotted as a function of cell aspect ratio, S. Each data point represents an individual cell. Our model provides a parameter-free prediction of this relationship (red line), which captures the mean trend in the data, plotted as a gaussian-weighted moving average (σ = 0.25; blue line) ± one standard deviation (blue region). Inset: the model of cell shape is illustrated schematically.
Figure 4
Figure 4. An extended model predicts lamellipodial curvature and the relationship between speed and morphology
a, The radius of curvature of the leading edge calculated within the model as a function of A and S, Rc=L8(zL)81, with zL=4(S+1)(S+2)2 and L=AS+2A/S, is plotted against the measured radius of curvature (Rm, radius of best-fit circle of the front 40% of the cell). The red dashed line depicts Rc = Rm. b, Cell speed, Vcell, is shown as a function of cell aspect ratio, S. The model prediction Vcell=V0(1(4(S+1)(S+2)2)8) (red line; V0 determined empirically) is compared to the trend plotted as a gaussian-weighted moving average (σ =0.25; blue line) ± one standard deviation (blue region), from 695 individual cells (blue points). Purple crosses indicate the mean ± one standard deviation in speed and aspect ratio over 5 min for 11 individual cells (shown in Fig. 2a).

Comment in

References

    1. Carlier MF, Pantaloni D. Control of actin assembly dynamics in cell motility. J Biol Chem. 2007;282:23005–23009. - PubMed
    1. Pollard TD, Blanchoin L, Mullins RD. Molecular mechanisms controlling actin filament dynamics in nonmuscle cells. Annu Rev Biophys Biomol Struct. 2000;29:545–576. - PubMed
    1. Zaidel-Bar R, Cohen M, Addadi L, Geiger B. Hierarchical assembly of cell-matrix adhesion complexes. Biochem Soc Trans. 2004;32:416–420. - PubMed
    1. Bakal C, Aach J, Church G, Perrimon N. Quantitative morphological signatures define local signaling networks regulating cell morphology. Science. 2007;316:1753–1756. - PubMed
    1. Anderson KI, Cross R. Contact dynamics during keratocyte motility. Curr Biol. 2000;10:253–260. - PubMed

Publication types