

Review
doi: 10.1039/b717422e.
Epub 2008 Apr 8.
Managing evaporation for more robust microscale assays. Part 1. Volume loss in high throughput assays
Affiliations
- PMID: 18497901
- PMCID: PMC2453240
- DOI: 10.1039/b717422e
Item in Clipboard
Review
Managing evaporation for more robust microscale assays. Part 1. Volume loss in high throughput assays
Lab Chip.
2008 Jun.
Abstract
Evaporation is a well known issue when handling small liquid volumes. Here we present a review of microscale assays prone to evaporation and methods to make them more robust. Applications for these assays span from combinatorial chemistry to cell-biology where the stability of concentrations and osmolarity can be critical. A dimensionless evaporation number Ev is presented and used to characterize volume loss in short term and long term microscale assays. Ev can be used both as a design tool and as an analysis parameter. The advantageous use of evaporation in some applications is also discussed.
Figures
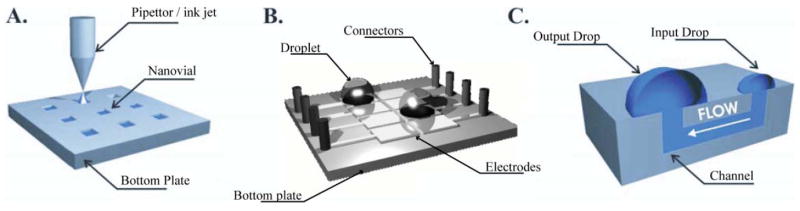
Example of microfluidic devices presenting open air–liquid interfaces susceptible to evaporation. A: Nanovial arrays. B: EWOD chip. C: Passive pumping chip.
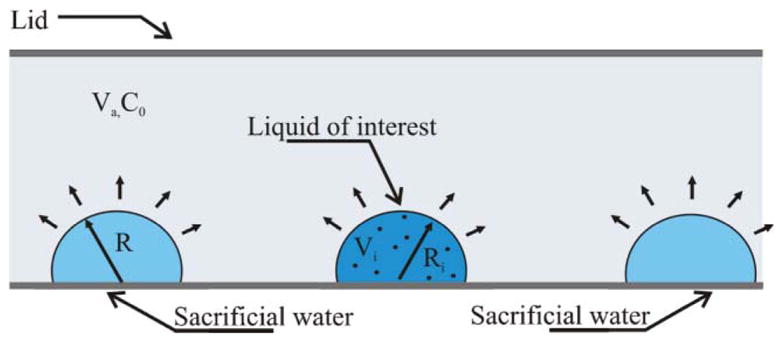
Parameters in the evaporation number Ev and Evini. The liquid is placed in a container of volume V a at a humidity C0. Drop k of volume V k has a radius of Rk.
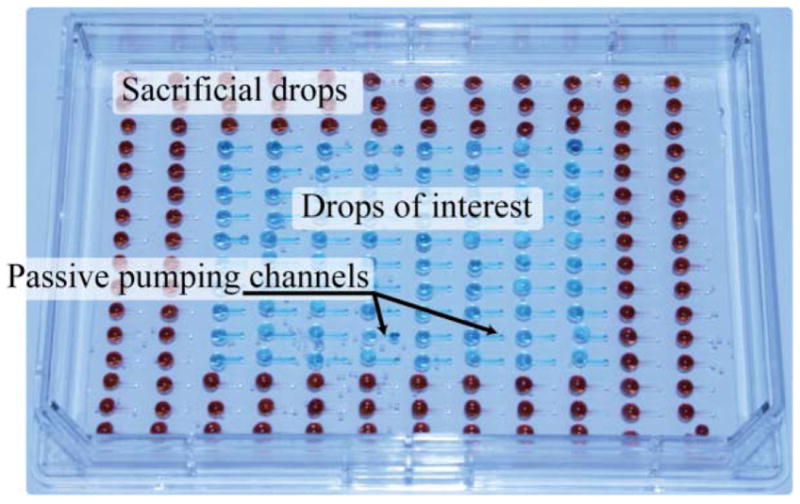
Experimental passive pumping based assay in an open Omnitray containing both drops of liquid of interest and sacrificial drops that will reduce volume loss on the drops of interest.
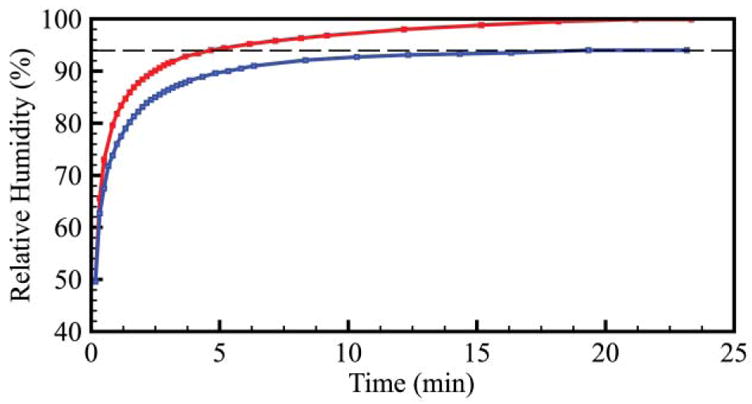
Humidity equilibration in a parafilm-sealed Omnitray (top line) and in a closed Omnitray (bottom line).
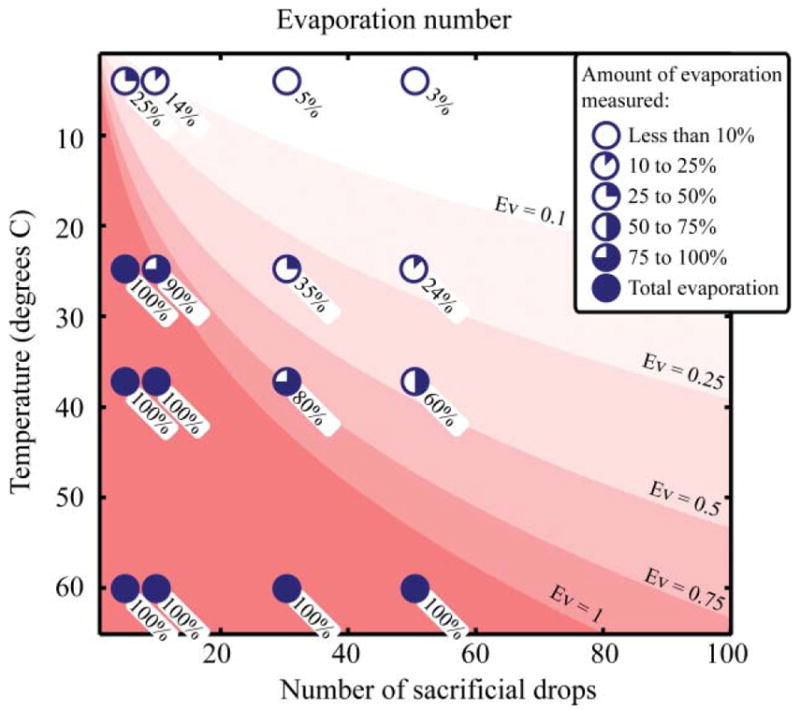
Evaporation numbers in a 4′ Petridish for a different number of sacrificial drops with one drop of interest at different temperatures but for the same absolute humidity concentration (concentration at 2° and 20% RH). Shades of red show increasing Ev numbers. Experimental data points and the measured fraction of evaporation are plotted with pie charts with the exact measured amount specified below.
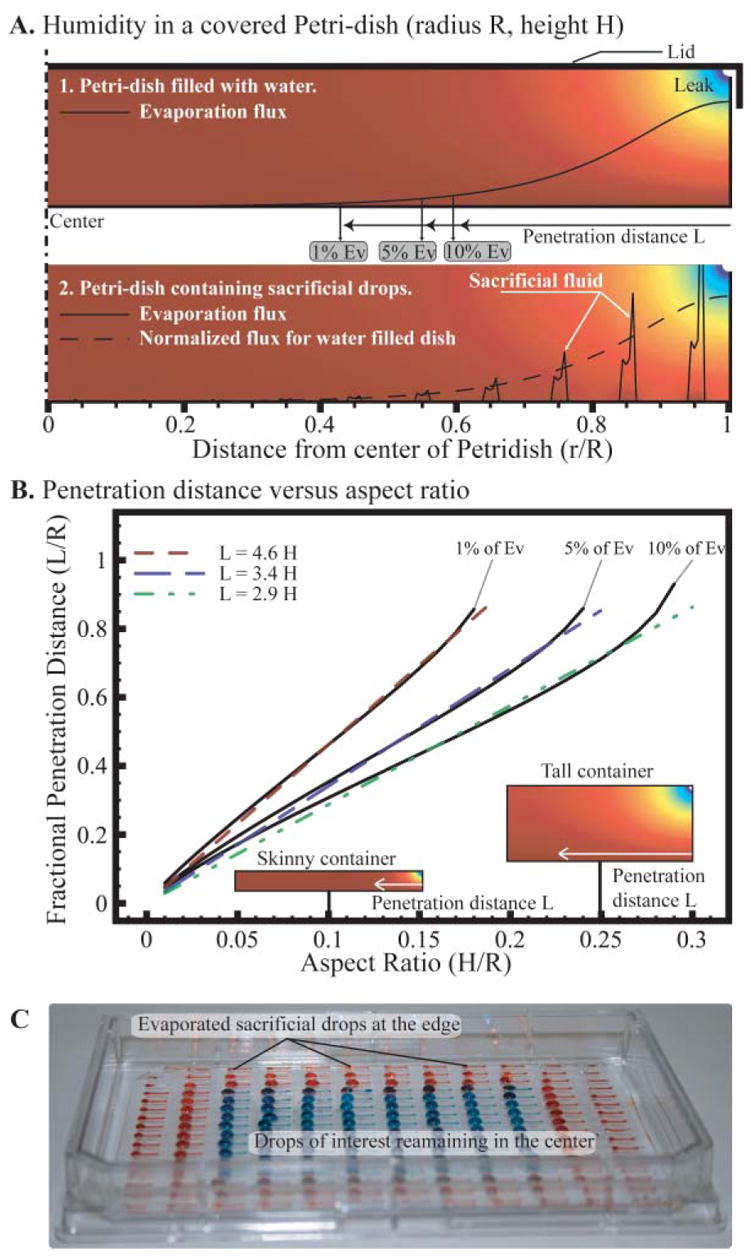
A. Humidity in a covered Petridish with a loose lid modeled in COMSOL with axisymetric geometry for both a dish filled with water (1) or containing an array of drops (2). The evaporation flux at the surface of the liquid is superposed and the distance, L, at which evaporation is reduced by x% is termed penetration distance. B. Penetration distance of the evaporation due to the leak as a fraction of the radius of the dish in function of the aspect ratio of the container. We observe that this distance is roughly proportional to the height of the container, and the coefficient depends on the percentage of evaporation reduction. C. Evaporation pattern in an Omnitray containing an array of passive pumping channels after 24 hours in room conditions with a lid. The 80 central channels are filled with blue colored water, and the 112 at the outskirts with red. This is the same device as in Fig. 3 after 24 h. If the leak spans the entire height of the dish, the penetration depth associated with 5% of Ev will be L = 2.3H + 0.03 (see ESI‡).
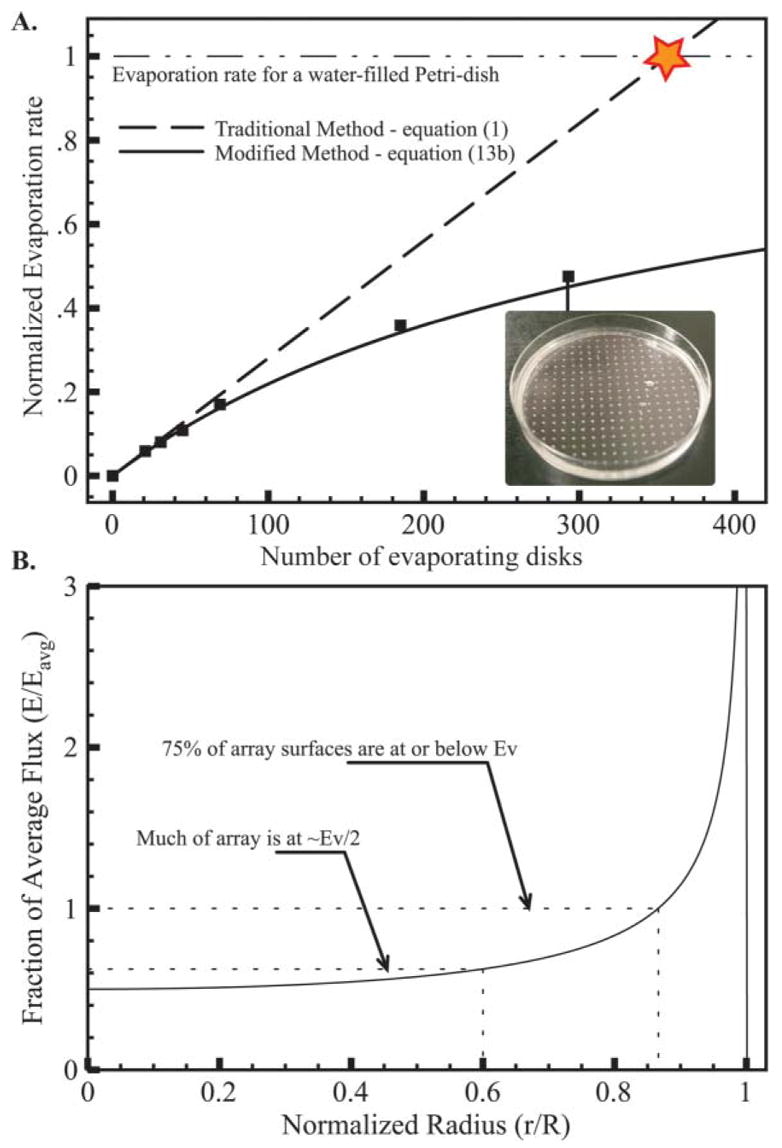
A. Total evaporation rate of an array of disk-shaped evaporating disks in a Petridish in function of their number. Experimental values (squares) are normalized by the evaporation rate for a whole evaporating Petridish filled with water. The average radius of the disks is found to be 112 μm using the evaporation rate of 21 disks and supposing the density effect is negligible. This value is used for plotting of the theoretical evaporation rates for both the traditional and modified model given by eqn (1) and eqn (13b) respectively. The maximum evaporation measured on a Petridish completely exposed is used to normalize these results and show the obvious contradiction of the traditional model. Note that even for 300 disks the distribution of the disks is sparse. B. Local evaporative flux from the center of the array out compared to the average flux. A slim band on the edge suffers severe evaporation whereas most of the array experiences less.
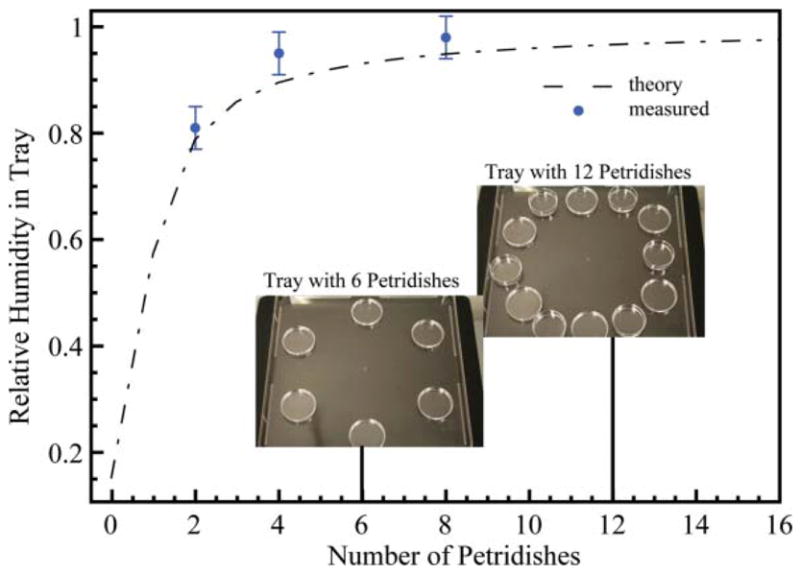
Humidity in a Bioassay Tray placed in an incubator at 37° and 10% relative humidity as a function of the number of Petridishes present inside. Theoretical values (dashed line) are found using eqn (12). Experimental values (dots) were measured for 3 configurations.
References
-
- Squires TM, Quake SR. Rev Mod Phys. 2005;77:977–1026.
-
- Wikswo JP, Prokop A, Baudenbacher F, Cliffel D, Csukas B, Velkovsky M. IEE Proc–Nanobiotechnology. 2006;153:81–101. - PubMed
-
- Lee SJ, Lee SY. Appl Microbiol Biotechnol. 2004;64:289–299. - PubMed
-
- Hietpas PB, Ewing AG. J Liq Chromatogr. 1995;18:3557–3576.
-
- Bratten CDT, Cobbold PH, Cooper JM. Anal Chem. 1997;69:253–258.
Publication types
MeSH terms
Grants and funding
LinkOut - more resources
Full Text Sources
Other Literature Sources