

The potential impact of climate change on annual and seasonal mortality for three cities in Québec, Canada
- PMID: 18498630
- PMCID: PMC2410102
- DOI: 10.1186/1476-072X-7-23
The potential impact of climate change on annual and seasonal mortality for three cities in Québec, Canada
Abstract
Background: The impact of climate change and particularly increasing temperature on mortality has been examined for three cities in the province of Québec, Canada.
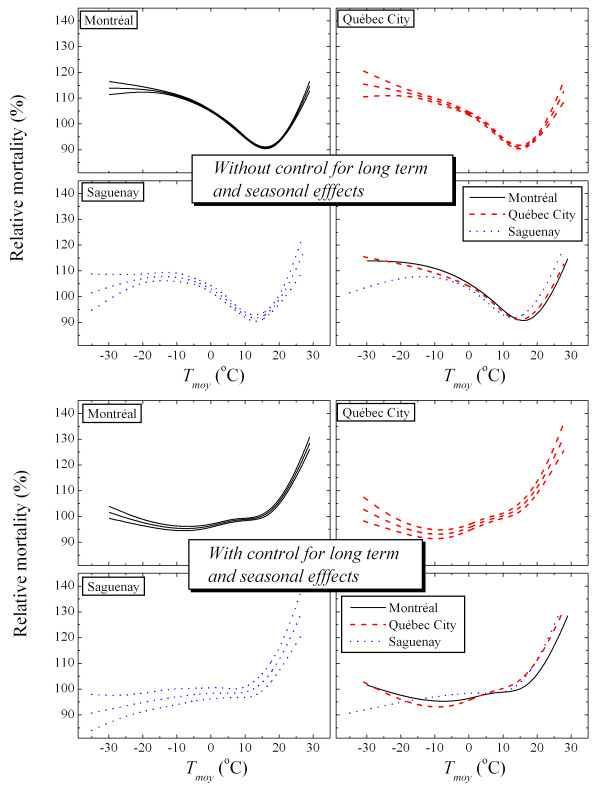
Methods: Generalized linear Poisson regression has been fitted to the total daily mortality for each city. Smooth parametric cubic splines of temperature and humidity have been used to do nonlinear modeling of these parameters. The model, to control for day of the week and for non-temperature seasonal factors, used a smooth function of time, including delayed effects. The model was then used to assess variation in mortality for simulated future temperatures obtained from an atmospheric General Circulation Model coupled with downscaling regression techniques. Two CO2 emission scenarios are considered (scenarios A2 and B2). Projections are made for future periods around year 2020 (2010-2039), 2050 (2040-2069) and 2080 (2070-2099).
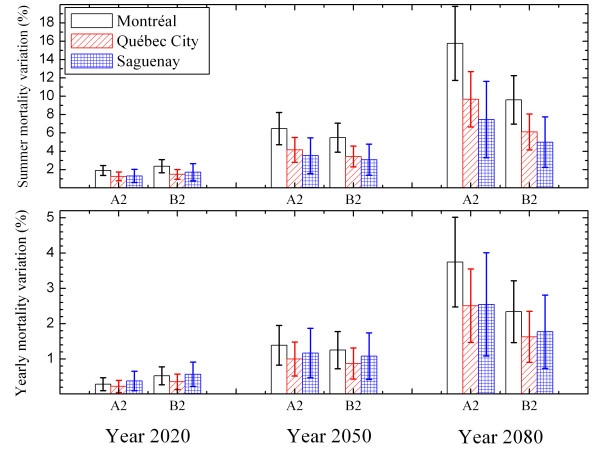
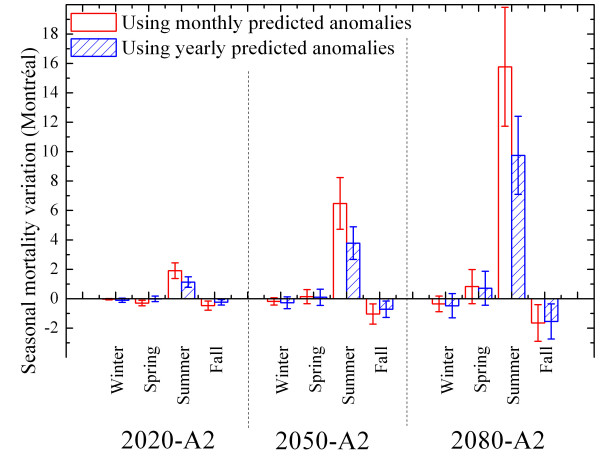
Results: A significant association between mortality and current temperature has been found for the three cities. Under CO2 emission scenarios A2 and B2, the mortality model predicts a significant increase in mortality in the summertime, and a smaller, but significant decrease in the fall season. The slight variations in projected mortality for future winter and spring seasons were found to be not statistically significant. The variations in projected annual mortality are dominated by an increase in mortality in the summer, which is not balanced by the decrease in mortality in the fall and winter seasons. The summer increase and the annual mortality range respectively from about 2% and 0.5% for the 2020 period, to 10% and 3% for the years around 2080. The difference between the mortality variations projected with the A2 or B2 scenarios was not statistically significant.
Conclusion: For the three cities, the two CO2 emission scenarios considered led to an increase in annual mortality, which contrasts with most European countries, where the projected increase in summer mortality with respect to climate change is overbalanced by the decrease in winter mortality. This highlights the importance of place in such analyses. The method proposed here to establish these estimates is general and can also be applied to small cities, where mortality rates are relatively low (ex. two deaths/day).
Figures
References
-
- Change IPC. Climate Change 2007-The Physical Science Basis. 2007. p. 1009 pages.http://www.ipcc.ch/ipccreports/ar4-wg1.htm
-
- World Health Organization . Planning meeting for ministries of health to address climate change and health : meeting report. Geneva, Switzerland; 2002.
-
- Confalonieri U, Menne B, Akhtar R, Ebi KL, Hauengue M, Kovats RS, Revich B, Woodward A. Human health. In: Parry ML, Canziani OF, Palutikof JP, van der Linden PJ and Hanson CE, editor. Climate Change 2007: Impacts, Adaptation and Vulnerability Contribution of Working Group II to the Fourth Assessment Report of the Intergovernmental Panel on Climate Change. Cambridge University Press; 2007. pp. 391–431.
-
- Bélanger D, Gosselin P, Poitras P. Changements climatiques au Québec méridional: perceptions des gestionnaires municipaux et de la santé publique [In French]. Vol. 539. Institut national de santé publique du Québec, Québec; 2006. p. 182.
Publication types
MeSH terms
Substances
LinkOut - more resources
Full Text Sources
