

Prevention of immunodeficiency virus induced CD4+ T-cell depletion by prior infection with a non-pathogenic virus
- PMID: 18499211
- PMCID: PMC2490720
- DOI: 10.1016/j.virol.2008.03.037
Prevention of immunodeficiency virus induced CD4+ T-cell depletion by prior infection with a non-pathogenic virus
Abstract
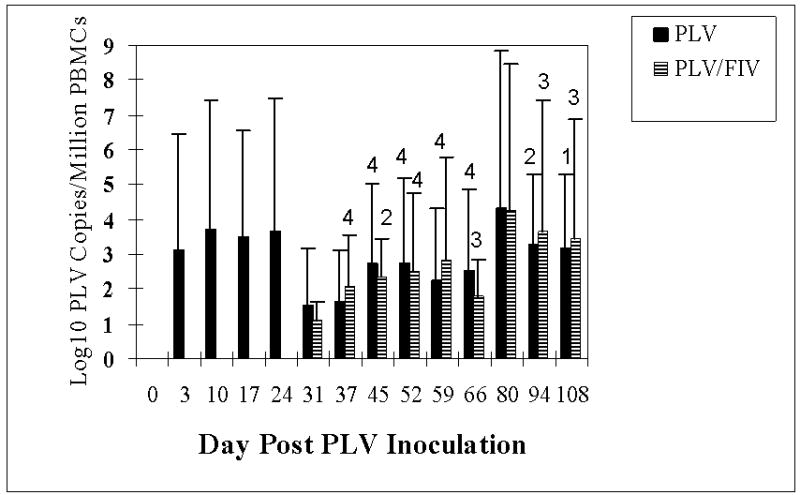
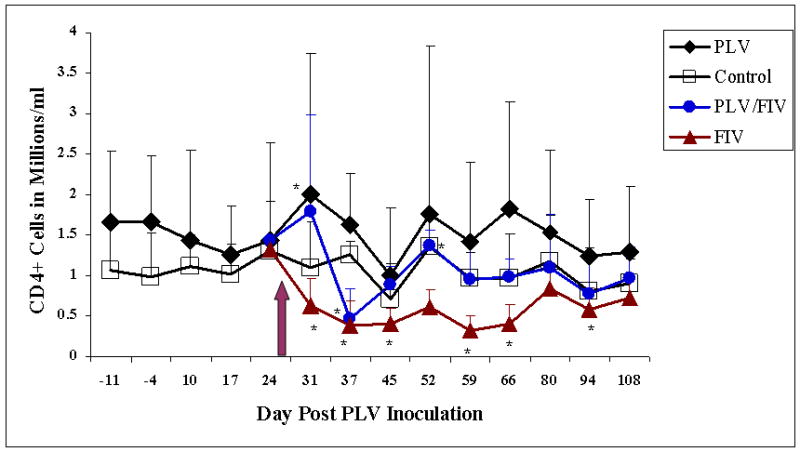
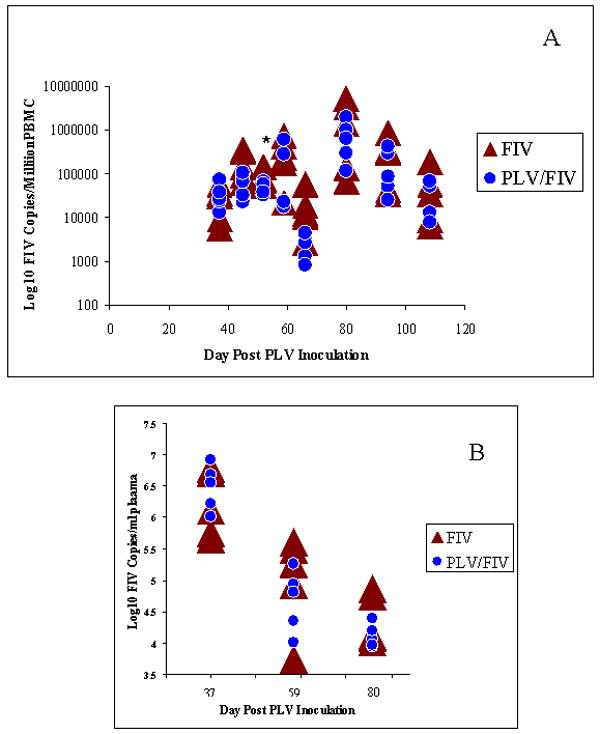
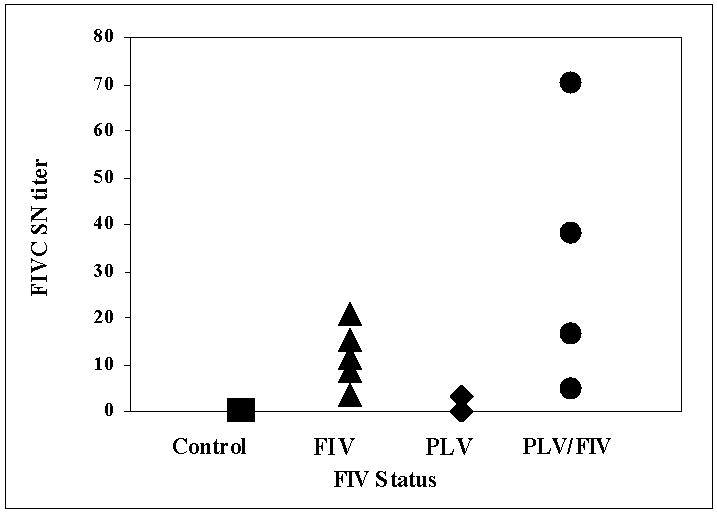
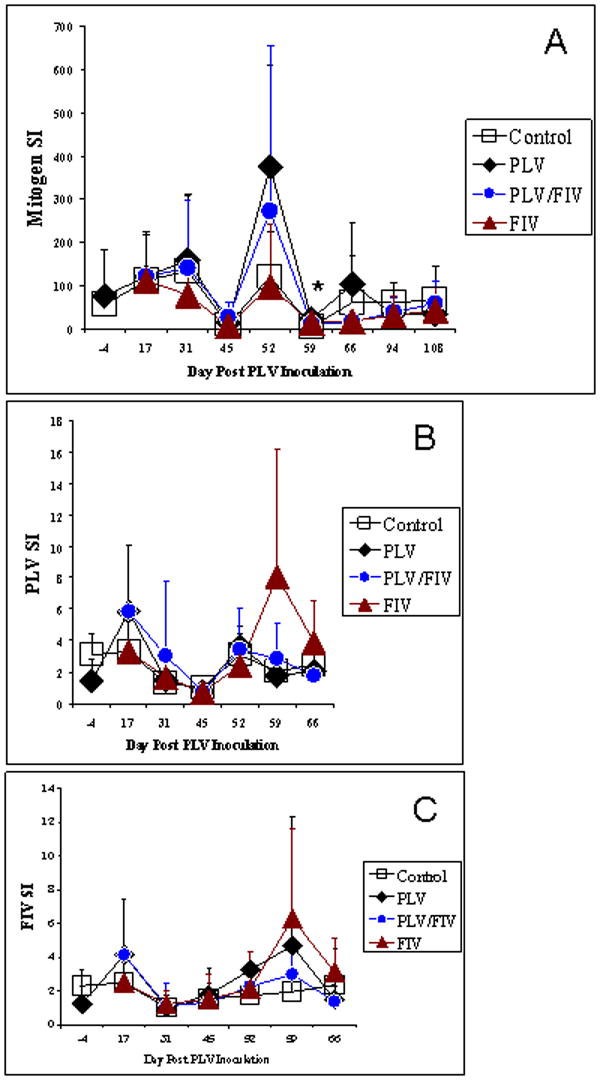
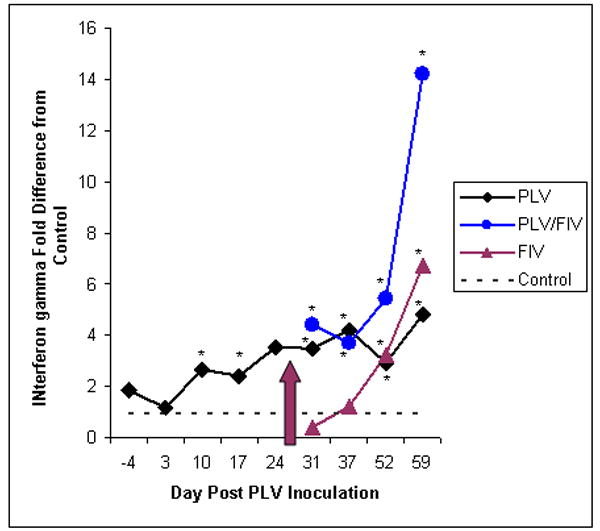
Immune dysregulation initiated by a profound loss of CD4+ T-cells is fundamental to HIV-induced pathogenesis. Infection of domestic cats with a non-pathogenic lentivirus prevalent in the puma (puma lentivirus, PLV or FIV(pco)) prevented peripheral blood CD4+ T-cell depletion caused by subsequent virulent FIV infection. Maintenance of this critical population was not associated with a significant decrease in FIV viremia, lending support to the hypothesis that direct viral cytopathic effect is not the primary cause of immunodeficiency. Although this approach was analogous to immunization with a modified live vaccine, correlates of immunity such as a serum-neutralizing antibody or virus-specific T-cell proliferative response were not found in protected animals. Differences in cytokine transcription profile, most notably in interferon gamma, were observed between the protected and unprotected groups. These data provide support for the importance of non-adaptive enhancement of the immune response in the prevention of CD4+ T-cell loss.
Figures
Similar articles
-
Prior virus exposure alters the long-term landscape of viral replication during feline lentiviral infection.Viruses. 2011 Oct;3(10):1891-908. doi: 10.3390/v3101891. Epub 2011 Oct 13. Viruses. 2011. PMID: 22069521 Free PMC article.
-
Domestic cats infected with lion or puma lentivirus develop anti-feline immunodeficiency virus immune responses.J Acquir Immune Defic Syndr. 2003 Sep 1;34(1):20-31. doi: 10.1097/00126334-200309010-00003. J Acquir Immune Defic Syndr. 2003. PMID: 14501789
-
Prior Puma Lentivirus Infection Modifies Early Immune Responses and Attenuates Feline Immunodeficiency Virus Infection in Cats.Viruses. 2018 Apr 20;10(4):210. doi: 10.3390/v10040210. Viruses. 2018. PMID: 29677149 Free PMC article.
-
Early events in the immunopathogenesis of feline retrovirus infections.J Am Vet Med Assoc. 1991 Nov 15;199(10):1311-5. J Am Vet Med Assoc. 1991. PMID: 1666073 Review.
-
Lentivirus-induced immune dysregulation.Vet Immunol Immunopathol. 2008 May 15;123(1-2):45-55. doi: 10.1016/j.vetimm.2008.01.011. Epub 2008 Jan 19. Vet Immunol Immunopathol. 2008. PMID: 18289702 Free PMC article. Review.
Cited by
-
Multivariate statistical analyses demonstrate unique host immune responses to single and dual lentiviral infection.PLoS One. 2009 Oct 6;4(10):e7359. doi: 10.1371/journal.pone.0007359. PLoS One. 2009. PMID: 19806226 Free PMC article.
-
Emerging viruses in the Felidae: shifting paradigms.Viruses. 2012 Feb;4(2):236-57. doi: 10.3390/v4020236. Epub 2012 Feb 7. Viruses. 2012. PMID: 22470834 Free PMC article. Review.
-
Error correction and statistical analyses for intra-host comparisons of feline immunodeficiency virus diversity from high-throughput sequencing data.BMC Bioinformatics. 2015 Jun 30;16:202. doi: 10.1186/s12859-015-0607-z. BMC Bioinformatics. 2015. PMID: 26123018 Free PMC article.
-
Domestic cat microsphere immunoassays: detection of antibodies during feline immunodeficiency virus infection.J Immunol Methods. 2013 Oct 31;396(1-2):74-86. doi: 10.1016/j.jim.2013.08.001. Epub 2013 Aug 14. J Immunol Methods. 2013. PMID: 23954271 Free PMC article.
-
Pathogenesis of oral FIV infection.PLoS One. 2017 Sep 21;12(9):e0185138. doi: 10.1371/journal.pone.0185138. eCollection 2017. PLoS One. 2017. PMID: 28934316 Free PMC article.
References
-
- Abel K, Compton L, Rourke T, Montefiori D, Lu D, Rothaeusler K, Fritts L, Bost K, Miller C. Simian-human immunodeficiency virus SHIV89.6-induced protection against intravaginal challenge with pathogenic SIVmac239 is independent of the route of immunization and is associated with a combination of cytotoxic T-lymphocyte and alpha interferon responses. J Virol. 2003;77:3009–3118. - PMC - PubMed
-
- Alimonti JB, Ball TB, Fowke KB. Mechanisms of CD4+ T Lymphocyte cell death in human immunodeficiency virus infection and AIDS. J Gen Virol. 2003;84:1649–1661. - PubMed
-
- Amara RR, Patel K, Niedziela G, Nigam P, Sharma S, Staprans SI, Montefiori DC, Chenareddi L, Herndon JG, Robinson HL, McClure HM, Novembre FJ. A combination DNA and attenuated simian immunodeficiency virus vaccine strategy provides inhanced protection from Simian/Human Immunodeficiency virus-induced disease. J Virol. 2005;79:l5356–15367. - PMC - PubMed
-
- Anderson RW, Ascher MS, Sheppard HW. Direct HIV cytopathicity cannot account for CD4 decline in AIDS in the presence of homeostasis: a worst-case dynamic analysis. JAIDS. 1998;17:245–252. - PubMed
Publication types
MeSH terms
Substances
Grants and funding
LinkOut - more resources
Full Text Sources
Research Materials
Miscellaneous
