. 2008 Jun;28(6):859-69.
doi: 10.1016/j.immuni.2008.04.010. Epub 2008 May 22.

Endogenous naive CD8+ T cell precursor frequency regulates primary and memory responses to infection

Affiliations

Endogenous naive CD8+ T cell precursor frequency regulates primary and memory responses to infection

Joshua J Obar et al. Immunity. 2008 Jun.

Abstract

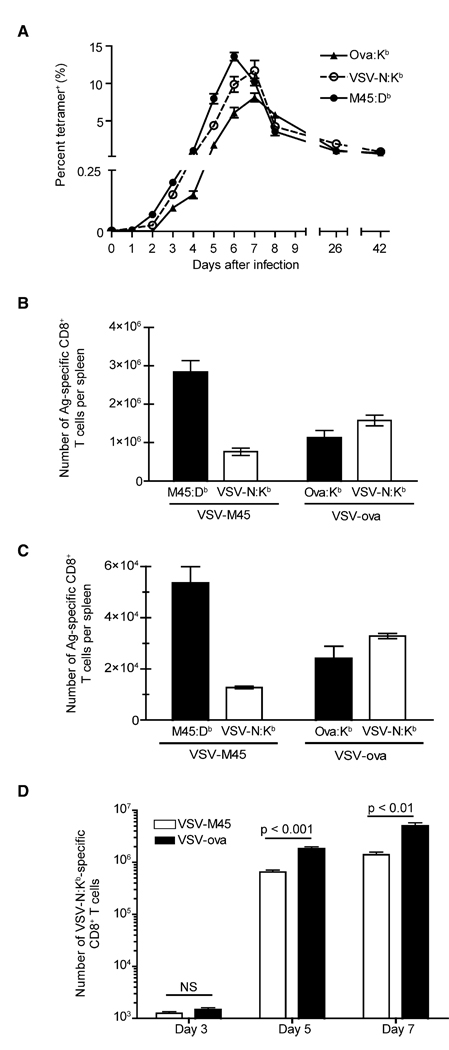
Through genetic recombination, the adaptive immune system generates a diverse T cell repertoire allowing recognition of a vast spectrum of foreign antigens. Any given CD8+ T cell specificity is thought to be rare, but none have been directly quantified. Here, major histocompatibility complex tetramer and magnetic-bead technology were coupled to quantitate naive antigen-specific CD8+ T cells and the early response to infection. Among six specificities measured, the number of naive antigen-specific precursors ranged from approximately 80 to 1200 cells/mouse. After vesicular stomatitis virus infection, the antigen-specific CD8+ T cell response occurred in discrete phases: prolonged activation of a subset of cells over the first 72 hr followed by a rapid proliferative burst. Naive precursor frequency altered response kinetics and regulated immunodominance, as well as the time required for the responding population to shift toward CD62L(hi) memory cells. Thus, initial endogenous precursor frequencies were surprisingly diverse and not only regulated initial immune response characteristics but also controlled memory CD8+ T cell lineage decisions.


Figures

Figure 1
Figure 1. Naive Antigen-Specific CD8+ T Cells Are Specifically Enriched with pMHC Class I Tetramers
(A) Flow-cytometry gates used to detect pMHC class I binding CD8+ T cells from total spleen and lymph node cells. Lymphocytes were gated on the basis of forward scatter (FSC) versus side scatter (SSC) (left plot); this was followed by gating of CD8+ T cells that were negative for the dump stain (CD4, CD11b, CD19, and B220) (right plot). (B) Representative control plots demonstrating the specificity of the pMHC class I tetramer enrichment protocol. Total spleen and lymph node cells from naive OT-I Rag2−/− mice (left plot), memory mice infected 3 weeks earlier with VSV (center plot), or naive C57BL/6 mice (right plot) were enriched with both PE- and APC-labeled M45:Db tetramers. (C) Phenotypic analysis of enriched tetramer+ cells. Histograms are gated on the dual tetramer+ cells as described above and are representative of all the specificities analyzed. Filled histograms represent cells enriched from naive C57BL/6 mice, and open histograms are representative of memory cells. (D) Vβ13 usage by naive and memory CD8+ T cells specific for either the VSV-N:Kb epitope or the Ova:Kb epitope. Histograms are gated on enriched tetramer +CD8+ T cells. These data are representative of two independent experiments, and the value indicates the percentage of antigen-specific CD8+ T cells utilizing the Vβ13 chain. (E) The majority of Ova:Kb-specific naive CD8+ T cells are deleted in mice constitutively expressing ovalbumin. Total spleen and lymph node cells were pooled from either naive C57BL/6 or naive 232-6 mice. Antigen-specific CD8+ T cells were enriched with either Ova:Kb or VSV-N:Kb tetramers. Contour plots were gated as above and are representative of two independent experiments.
Figure 2
Figure 2. Enumeration of the Precursor Frequencies of Multiple Naive Antigen-Specific CD8+ T Cell Populations
(A) Representative dot plots show the enrichment of tetramer+ cells for all the epitopes tested. Values represent the average precursor frequency (left value) and average cell number (right value) found in an individual C57BL/6 mouse. (B and C) Graphical depiction of the absolute numbers (B), and reciprocal frequency of the naive antigen-specific CD8+ T cells from total spleen and lymph nodes cells of individual mice (C). Each symbol represents an individual mouse, and the bar indicates mean values.
Figure 3
Figure 3. Tracking of Early Activation and Expansion of Endogenous Antigen-Specific CD8+ T Cells after VSV Infection
C57BL/6 mice were infected with 2 × 10⁵ PFU of VSV-M45. M45:Db-specific CD8+ T cells were monitored in the spleen by tetramer enrichment for the first 4 days. (A) Histograms are gated on enriched M45:Db-specific CD8+ T cells. CD69 expression (left plots), FSC (center plots), and CD11a expression (right plots) were compared. The open histograms represent the antigen-specific CD8+ T cell population and in the top row the shaded histogram depicts “naive” (CD11alo) CD8+ T cells. The same expression pattern was observed for the VSV-N:Kb-specific CD8+ T cell population (data not shown). These data are representative of three independent experiments. (B) Kinetics of the early expansion of the M45:Db-specific CD8+ T cells. Each dot represents the mean of three or four individual mice with the bar representing the standard deviation of the data. These data are representative of three separate experiments. (C) Mice were infected with VSV-M45 and given 800 mg of BrdU i.p. daily. Mice were sacrificed 2 or 3 days later, and the enriched M45:Db-specific splenic CD8+ T cells were analyzed for BrdU incorporation by flow cytometry. The contour plots are gated on the CD8+CD11bCD4CD19B220 cells. These data are representative of two independent experiments.
Figure 4
Figure 4. The Kinetics and Immunodominance of the CD8+ T Cell Response Is Dictated by Naive Precursor Frequency
(A) C57BL/6 mice were infected with 2 × 10⁵ PFU of either VSV-M45 or VSV-ova. The frequency of M45:Db-specific (filled circles), VSV-N:Kb-specific (open circles), and Ova:Kb-specific (filled triangles) CD8+ T cells was quantified daily for the first 9 days and then at day 26 and 42 after infection. The N-specific values were obtained from the VSV-ova infection. Each data point is the mean value ± 1 standard deviation from three to five mice. These data are representative of three independent experiments. (B and C) The absolute number of antigen-specific CD8+ T cells in the spleen was measured at the peak of the response (day 6 for M45:Db and day 7 for both VSV-N:Kb and Ova:Kb) (B) or 71 days after infection (C) with either VSV-M45 or VSV-ova. Each bar represents the mean for that specificity ± 1 standard deviation from three to five mice. These data are representative of three independent experiments. (D) Mice were infected with 2 × 10⁵ PFU of either VSV-M45 or VSV-ova. The magnitude of the VSV-N:Kb-specific splenic CD8+ T cell response was measured on days 3, 5, and 7 after infection. Day 3 analysis was performed by tetramer enrichment. Each bar represents the mean of four mice with ± 1 standard deviation. Statistical significance was determined with a two-tailed Student’s t test. These data are representative of two independent experiments.
Figure 5
Figure 5. Initial Precursor Frequency Controls CD62L Expression
Mice were infected with 2 × 10⁵ PFU of either VSV-M45 or VSV-ova. The expression of CD62L on the cell surface of M45:Db-specific (filled circles), VSV-N:Kb-specific (open circles), and Ova:Kb-specific (filled triangles) splenic CD8+ T cells was analyzed up to ~150 days after infection. Each data point is the mean value from three to five mice ± 1 standard deviation. Statistical significance was determined by a two-tailed Student’s t test (**, p < 0.01). These data are representative of two independent experiments.
Figure 6
Figure 6. Naive Precursor Frequency Does Not Alter Homeostatic Proliferation of Endogenous Memory Cells
Mice infected 30 days previously with either VSV-M45 or VSV-ova were given BrdU in their drinking water for 4 weeks, and BrdU incorporation into splenic antigen-specific CD8+ T cells was determined. The graph shows the BrdU incorporation ratio of the CD62Lhi to CD62Llo antigen-specific memory cells. A value greater than 1.0 indicates that more CD62Lhi memory cells have incorporated BrdU. Each bar represents the mean value of three mice ± 1 standard deviation. These data are representative of two independent experiments.
Figure 7
Figure 7. CD62L Gene Expression Is Not Altered by Differences in Endogenous Naive T Cell Precursor Frequencies
(A) Either 5 × 10⁵ or 5 × 10³ OT-I cells (CD45.1+) were transferred to CD45.2+ mice. One day later, the mice were infected with 2 × 10⁵ PFU of VSV-ova. Either 1 or 2 weeks later, splenic CD45.1+CD8+ T cells were flow-sorted on the basis of CD62L expression (purity > 98%), and RNA was analyzed by quantitative RT-PCR. CD62L mRNA expression was normalized to β-actin expression, and its expression relative to naive OT-I cells was determined by the equation 2−ΔΔCt, as previously done (Obar et al., 2004). These data are representative of three independent experiments. (B) CD62L mRNA expression in the endogenous antigen-specific CD62Llo-CD8+ T cells of different specificities was determined at 2 weeks after infection. As a control, either 2 × 10⁵ or 2 × 10³ OT-I cells (CD45.1+) were transferred to naive CD45.2+ mice. Two weeks after VSV-ova infection, CD45.1+CD8+ T cells from the spleen were sorted on the basis of CD62L expression (purity > 98%). For endogenous cells, CD62LloCD8+ T cells were sorted by pMHC class I tetramers (purity > 98%). CD62L mRNA was quantitated as above. These data are representative of two independent experiments.

Similar articles

Cited by

References

    1. Altman JD, Moss PAH, Goulder PJR, Barouch DH, McHeyzer-Williams MG, Bell JI, McMichael AJ, Davis MM. Phenotypic analysis of antigen-specific T lymphocytes. Science. 1996;274:94–96. - PubMed
    1. Badovinac VP, Haring JS, Harty JT. Initial T cell receptor transgenic cell precursor frequency dictates critical aspects of the CD8(+) T cell response to infection. Immunity. 2007;26:827–841. - PMC - PubMed
    1. Bahl K, Kim SK, Calcagno C, Ghersi D, Puzone R, Celada F, Selin LK, Welsh RM. IFN-induced attrition of CD8 T cells in the presence or absence of cognate antigen during the early stages of viral infections. J. Immunol. 2006;176:4284–4295. - PubMed
    1. Barnes E, Ward SM, Kasprowicz VO, Dusheiko G, Klenerman P, Lucas M. Ultra-sensitive class I tetramer analysis reveals previously undetectable populations of antiviral CD8+ T cells. Eur. J. Immunol. 2004;34:1570–1577. - PubMed
    1. Berg LJ, Fazekas de St GB, Ivars F, Goodnow CC, Gilfillan S, Garchon HJ, Davis MM. Expression of T-cell receptor alpha-chain genes in transgenic mice. Mol. Cell. Biol. 1988;8:5459–5469. - PMC - PubMed

Publication types

MeSH terms