. 2008 Jul 15;586(14):3325-35.
doi: 10.1113/jphysiol.2008.153965. Epub 2008 May 22.

Differential dissociation of G protein heterotrimers

Affiliations

Differential dissociation of G protein heterotrimers

Gregory J Digby et al. J Physiol. .

Abstract

Signalling by heterotrimeric G proteins is often isoform-specific, meaning certain effectors are regulated exclusively by one family of heterotrimers. For example, in excitable cells inwardly rectifying potassium (GIRK) channels are activated by G betagamma dimers derived specifically from G(i/o) heterotrimers. Since all active heterotrimers are thought to dissociate and release free G betagamma dimers, it is unclear why these channels respond primarily to dimers released by G(i/o) heterotrimers. We reconstituted GIRK channel activation in cells where we could quantify heterotrimer expression at the plasma membrane, GIRK channel activation, and heterotrimer dissociation. We find that G(oA) heterotrimers are more effective activators of GIRK channels than G(s) heterotrimers when comparable amounts of each are available. We also find that active G(oA) heterotrimers dissociate more readily than active G(s) heterotrimers. Differential dissociation may thus provide a simple explanation for G alpha-specific activation of GIRK channels and other G betagamma-sensitive effectors.


Figures

Figure 4
Figure 4. A2AR receptor expression does not limit Gβ1γ2/11-V translocation
Plots of the average normalized ratios of membrane-to-intracellular (M/I) Gβ1γ2/11-V fluorescence intensity from cells transfected with C-TM-Gαs and either 0.1 μg (n = 8) or 0.8 μg (n = 7) of A2AR plasmid DNA; thinner lines represent the average ± s.e.m. The agonist sensitivity was enhanced by transfecting more plasmid DNA, suggesting more A2ARs were expressed. The maximal Gβ1γ2/11-V translocation was the same in both cases, suggesting that A2AR expression was not a limiting factor.
Figure 1
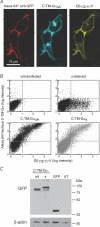
Figure 1. Comparable expression of C-TM-GαoA and C-TM-Gαs
A, confocal images of live cells expressing C-TM-GαoA and Gβ1γ2/11-V stained using Alexa 647-conjugated anti-GFP. Alexa 647 signal (633 nm excitation) is present only on the cell surface, whereas C-TM-GαoA signal (458 nm excitation) is present at the plasma membrane and in intracellular compartments. B, scatter plots of Alexa 647 and Gβ1γ2/11-V fluorescence intensity from samples of 104 cells. Untransfected cells showed no fluorescence in either channel, unstained cells showed Gβ1γ2/11-V fluorescence only, and cells transfected with C-TM-GαoA and C-TM-Gαs showed comparable levels of Alexa 647 fluorescence. The quadrants indicate threshold (above background) fluorescence levels. C, an immunoblot probed with a polyclonal anti-GFP antibody (top) and reprobed with an anti-β-actin antibody (bottom). Protein samples were prepared from cells transfected with C-TM-GαoA or C-TM-Gαs (together with unlabelled Gβ and Gγ subunits) and EGFP alone as well as untransfected controls (UT). Both C-TM-Gα subunits migrate as a single predominant species; the larger size of C-TM-Gαs is predicted by the greater length (40 amino acids) of this Gα isoform.
Figure 2
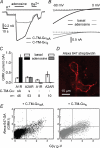
Figure 2. Differential activation of GIRK channels by C-TM-GoA and C-TM-Gs heterotrimers
A, exemplary traces from cells expressing GIRK1/2 heteromers, Gβ1γ2/11-V, and either C-TM-GαoA and A1Rs or C-TM-Gαs and A2ARs. High (30 mm) K+ solution reveals basal inward current in both cases, and additional current in the presence of adenosine (10 μm); Ba2+ refers to 0.2 mm barium. The slow reversal of adenosine-activated current in the cell expressing C-TM-Gαs was characteristic of these cells. B, current responses to voltage ramps from –90 mV to 0 mV recorded from the same cells shown in panel A. C, summary of basal and evoked GIRK currents in cells expressing the indicated combinations of adenosine receptors, C-TM-Gα subunits and Gβ1γ2/11-V dimers or adenosine receptors only. C-TM-GαoA subunits harboured a mutation (C351G) rendering them insensitive to PTX, and all cells were treated overnight with PTX. D, a confocal image showing plasma membrane fluorescence in cells expressing metabolically biotinylated GIRK1/2 channels stained with Alexa 647-conjugated streptavidin. E, scatter plots of Alexa 647 and Gβ1γ2/11-V fluorescence intensity from samples of 104 cells expressing metabolically biotinylated GIRK1/2 channels and either C-TM-GαoA or C-TM-Gαs. Live cells were stained with Alexa 647-conjugated streptavidin (SA). Comparable levels of Alexa 647 fluorescence are evident above background levels (indicated by the quadrants; representative data from 3 similar experiments).
Figure 3
Figure 3. Differential dissociation of C-TM-GoA and C-TM-Gs heterotrimers
A, images of venus fluorescence in a cell expressing C-TM-GαoA, Gβ1γ2/11-V and A1Rs before (control) and after (adenosine) application of 10 μm adenosine; the lookup table is inverted for clarity. Gβ1γ2/11-V fluorescence translocates from the plasma membrane to the cell interior. This is shown more clearly in the difference image (right), where regions that lost fluorescence after adenosine are pseudocoloured blue, and regions that gained fluorescence are pseudocoloured red. Regions of interest (ROI) typical of membrane and intracellular regions are show in blue and red, respectively. B, plots of the average normalized ratios of membrane-to-intracellular (M/I) Gβ1γ2/11-V fluorescence intensity from cells expressing C-TM-GαoA and A1Rs (n = 50) or C-TM-Gαs and A2ARs (n = 52); thinner lines represent the average ± s.e.m. C, CFP (left) and venus (right) fluorescence intensity in a narrow region of interest including the plasma membrane in cells expressing C-TM-GαoA (n = 15) or C-TM-Gαs (n = 18) together with Gβ1γ2/11-V and cognate adenosine receptors.
Figure 5
Figure 5. The apparent affinity of active C-TM-Gαs for Gβ1γ2-V is higher than that of active C-TM-GαoA
A, images of HEK 293 cells bathed in 0.1 mm BODIPY FL GTPγS. Intact cells exclude green fluorescence, whereas cells permeabilized with α-toxin accumulate the labelled nucleotide. B, recovery of Gβ1γ2-V fluorescence into photobleached regions of the plasma membrane in cells expressing immobile C-TM-GαoA or C-TM-Gαs. Cells were permeabilized in the presence of 0.1 mm GTPγS and 10 μm adenosine or 1 mm GDPβS. Traces are the average of all experiments summarized in panels C and D. C, summary of fluorescence recovery 180 s after photobleaching in cells expressing C-TM-GαoA (left) together with Gβ1γ2-V (right). Both were mobile in cells that were not antibody crosslinked (no Ab; n = 6), as indicated by complete fluorescence recovery. Both became less mobile in crosslinked cells loaded with GDPβS (n = 11). C-TM-GαoA mobility was not significantly increased in crosslinked cells loaded with GTPγS, whereas Gβ1γ2-V mobility was significantly increased in these cells (n = 14), indicating a GTPγS-induced decrease in the affinity of C-TM-GαoA for Gβ1γ2-V. D, summary of fluorescence recovery in cells expressing C-TM-Gαs (left) and Gβ1γ2-V (right). Both were mobile without antibody crosslinking (no Ab; n = 6), and both became less mobile in crosslinked cells loaded with GDPβS (n = 10). C-TM-Gαs mobility was not increased in cells loaded with GTPγS, whereas Gβ1γ2-V mobility was significantly increased in these cells (n = 14), indicating a GTPγS-induced decrease in the affinity of C-TM-Gαs for Gβ1γ2-V. Comparison of cells expressing C-TM-GαoA and C-TM-Gαs indicated that Gβ1γ2-V mobility was greater both in cells loaded with GDPβS (P < 0.0005) and in cells loaded with GTPγS (P < 0.00001), indicating that in both cases the affinity of immobile C-TM-GαoA for Gβ1γ2-V was lower.

References

    1. Akgoz M, Kalyanaraman V, Gautam N. Receptor-mediated reversible translocation of the G protein β complex from the plasma membrane to the Golgi complex. J Biol Chem. 2004;279:51541–51544. - PubMed
    1. Akgoz M, Kalyanaraman V, Gautam N. G protein b complex translocation from plasma membrane to Golgi complex is influenced by receptor γ subunit interaction. Cell Signal. 2006;18:1758–1768. - PMC - PubMed
    1. Azpiazu I, Gautam N. A fluorescence resonance energy transfer-based sensor indicates that receptor access to a G protein is unrestricted in a living mammalian cell. J Biol Chem. 2004;279:27709–27718. - PubMed
    1. Beckett D, Kovaleva E, Schatz PJ. A minimal peptide substrate in biotin holoenzyme synthetase-catalyzed biotinylation. Protein Sci. 1999;8:921–929. - PMC - PubMed
    1. Breitwieser GE, Szabo G. Uncoupling of cardiac muscarinic and β-adrenergic receptors from ion channels by a guanine nucleotide analogue. Nature. 1985;317:538–540. - PubMed

Publication types

MeSH terms

Substances