. 2008 May 27;105(21):7576-81.
doi: 10.1073/pnas.0800537105. Epub 2008 May 22.

Neuronal avalanches organize as nested theta- and beta/gamma-oscillations during development of cortical layer 2/3

Affiliations

Neuronal avalanches organize as nested theta- and beta/gamma-oscillations during development of cortical layer 2/3

Elakkat D Gireesh et al. Proc Natl Acad Sci U S A. .

Abstract

Maturation of the cerebral cortex involves the spontaneous emergence of distinct patterns of neuronal synchronization, which regulate neuronal differentiation, synapse formation, and serve as a substrate for information processing. The intrinsic activity patterns that characterize the maturation of cortical layer 2/3 are poorly understood. By using microelectrode array recordings in vivo and in vitro, we show that this development is marked by the emergence of nested - and beta/gamma-oscillations that require NMDA- and GABA(A)-mediated synaptic transmission. The oscillations organized as neuronal avalanches, i.e., they were synchronized across cortical sites forming diverse and millisecond-precise spatiotemporal patterns that distributed in sizes according to a power law with a slope of -1.5. The correspondence between nested oscillations and neuronal avalanches required activation of the dopamine D(1) receptor. We suggest that the repetitive formation of neuronal avalanches provides an intrinsic template for the selective linking of external inputs to developing superficial layers.


Conflict of interest statement

Conflict of interest statement: Provisional patent filing PCT/US2006/03 1884 “Neuronal Avalanche Assay.”

Figures

Fig. 1.
Fig. 1.
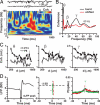
Nested θ- and β/γ-oscillations emerge during maturation of cortical layer 2/3. (A) Sketch of the 8 × 4 MEA placement in somatosensory cortex in vivo. (Left) PIA, pia mater; WM, white matter; IED, interelectrode distance of 200 μm. (Right) The 60-μm-thick Nissl-stained section with tracks from four electrode shanks (arrows). (B) (Left) Sketch of the 8 × 8 MEA placement in the cortex–VTA coculture. (Right) Light microscopic image of the living coculture (12 DIV). IED, 200 μm. (C and D) Spontaneous bursts at P8 and P13 in vivo (C) and at DIV 14 in vitro (D). Brackets, Periods in E and F. (E) Nested θ- and β/γ-oscillations emerge during the second week postnatal in vivo. Time–frequency plot for burst periods in C at P8 (Left) and at P13 (Right) in vivo. (F) Nested θ- and β/γ-oscillations in vitro. Time–frequency plot for burst period in D. (G and H) Burst amplitude (G) and duration (H) increase significantly during the second week postnatal. (I) θ-, β-, and γ-frequency power increases significantly during second week postnatal (normalized to power at P8 in vivo and DIV 6 in vitro).
Fig. 2.
Fig. 2.
Coherence between cortical sites peaks at θ-, β-, and γ-frequencies. (A) Time course and corresponding time–coherence plot for two simultaneous bursts separated by 600 μm. Note transient period of high coherence at θ- and γ-frequencies at ≈500 ms and a longer lasting coherence at θ-frequency. (B) Time-averaged coherence spectrum (black) from A reveals peaks in the θ-, β-, and γ-frequency band. (Red) Expected coherence from corresponding time-shifted traces. (C) Change in coherence during the second week and distance (d) dependence of the coherence for θ-, β-, and γ-frequencies (normalized to corresponding coherence from time-shift traces). (D) Summary of size and relative timing of the average nLFP peak for all electrodes with MU activity (in vivo; n = 3 experiments; colors). (Left) Average MU-triggered LFP waveform at one electrode. (Center) Average nLFP amplitude normalized to the SD of the average nLFP from randomly chosen time points within a burst. (Right) MU-activity peaks around the time of the nLFP. Average unit density functions around the time of nLFP occurrences.
Fig. 3.
Fig. 3.
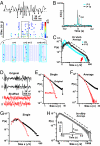
Nested θ- and β/γ-oscillations organize in the form of neuronal avalanches. (A) Definition of neuronal avalanches formed by the nested θ- and β/γ-oscillations. (Top) Threshold detection (broken line) of nLFPs (filled circles) at a single electrode. (Middle) Corresponding time–amplitude raster plot of nLFPs on the MEA (color: nLFP amplitude). (Bottom) Spatiotemporal nLFP clusters occupy successive bins of width Δtavg (dotted rectangles). (B) Average cross-correlation function for nLFPs in vivo at P8 (red) and P13 (black; single experiments). (C) nLFP clusters from nested θ- and β/γ-oscillations organize in the form of neuronal avalanches, i.e., distribute in sizes according to a power law with slope close to α = −1.5 (broken line). Average cluster size distribution in vivo plotted in log–log coordinates for P8 (red open circles; n = 5) and P13 (black; n = 7). (D) Example of two simultaneous burst periods before (black) and after (red) phase-shuffling. (E) The power law in cluster sizes is established for cluster area and cluster intensity (G) in single in vivo experiments and in the average (n = 7; F; cp. also C; all P13), but is destroyed on phase-shuffling of the LFP (open red). (H) Average cluster size distribution in vitro follows a power law with slope α ≅ −1.5 (broken line; n = 15; ≥10 DIV). (Inset) Average nLFP cross-correlation function for single experiment.
Fig. 4.
Fig. 4.
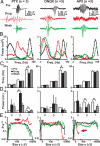
Nested θ- and β/γ-oscillations in vitro predominantly depend on the GABAA and glutamatergic NMDA receptor. (A) Example bursts before (Pre), during (Drug), and after drug application (Wash). Picrotoxin (PTX) (10 μM) (Left) induces prolonged, ictal-like bursts, whereas DNQX (10 μM) has no effect (Center). In contrast, AP5 (50 μM) (Right) selectively abolishes high-frequency oscillations. (B) Time-averaged wavelet spectrum of the color-coded traces in A. Note the shift toward β-oscillations caused by PTX and the block of high-frequency oscillations by AP5. (C) Change in peak frequency within each frequency band for all three antagonists. (D) Change in peak power within each frequency band (normalized to the pre condition). (E) Disinhibition by PTX increases the number of large avalanche sizes (Left; arrow), whereas AP5 blocks most avalanches (Right; arrow; single cultures). For better visualization, each distribution was normalized to the maximum value of P and transformed by PP · s−α (α taken from precondition). This transformation changes the power law into a horizontal distribution.
Fig. 5.
Fig. 5.
Tonic dopamine D1 receptor activation organizes nested θ- and β/γ-oscillations into neuronal avalanches. (A) In vitro example bursts before (pre), during SCH23390 (SCH) (10 μM), and after (wash). (B) SCH23390 reduces the probability of large avalanches in vivo. The size distribution of avalanches before (Top), during (Middle), and after (Bottom) drug application are overplotted for each experiment (n = 5; P12–P15, color-coded). Each distribution was normalized and transformed by PP · s−α. A downward tilt from the horizontal precondition (upper arrow) and early cutoff in the distribution (bottom arrow) indicates a reduction in large avalanches, i.e., a steeper slope α in the distribution (slope: P = 0.003; pre vs. drug). (C) Change in slope α in response to 10 μM SCH23390 for the in vitro networks (DIV 10–15). As shown in B for in vivo, SCH23390 reduces the probability of larger avalanches (n = 6; >DIV 10, color-coded; slope, P = 0.003; pre vs. drug). (D) The power at peak γ-frequency is reduced by SCH23390 (−33%, P = 0.01 in vivo; −61%, P = 0.03 in vitro). (E) The peak γ-frequency is unaffected by SCH23390 (P > 0.2 in vivo; P > 0.1 in vitro). (F) The coherence across electrodes at peak γ-frequency is reduced by SCH23390 (in vivo: mean, −32%, P < 0.001; in vitro: mean, −40%, P = 0.005).

References

    1. Spitzer NC. Electrical activity in early neuronal development. Nature. 2006;444:707–712. - PubMed
    1. Khazipov R, Luhmann HJ. Early patterns of electrical activity in the developing cerebral cortex of humans and rodents. Trends Neurosci. 2006;29:414–418. - PubMed
    1. O'Donovan MJ. The origin of spontaneous activity in developing networks of the vertebrate nervous system. Curr Opin Neurobiol. 1999;9:94–104. - PubMed
    1. Ben-Ari Y. Developing networks play a similar melody. Trends Neurosci. 2001;24:353–360. - PubMed
    1. Ignacio MP, Kimm EJ, Kageyama GH, Yu J, Robertson RT. Postnatal migration of neurons and formation of laminae in rat cerebral cortex. Anat Embryol (Berlin) 1995;191:89–100. - PubMed

Publication types

LinkOut - more resources