. 2008 Jul 10;454(7201):236-40.
doi: 10.1038/nature06998. Epub 2008 May 25.

Imaging the biogenesis of individual HIV-1 virions in live cells

Affiliations

Imaging the biogenesis of individual HIV-1 virions in live cells

Nolwenn Jouvenet et al. Nature. .

Abstract

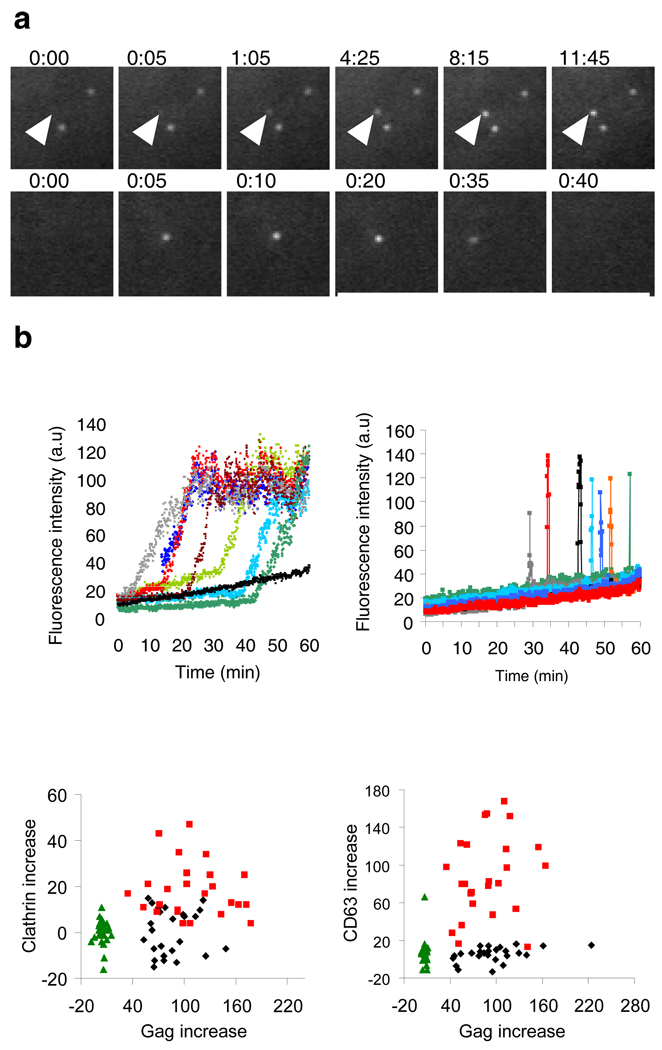
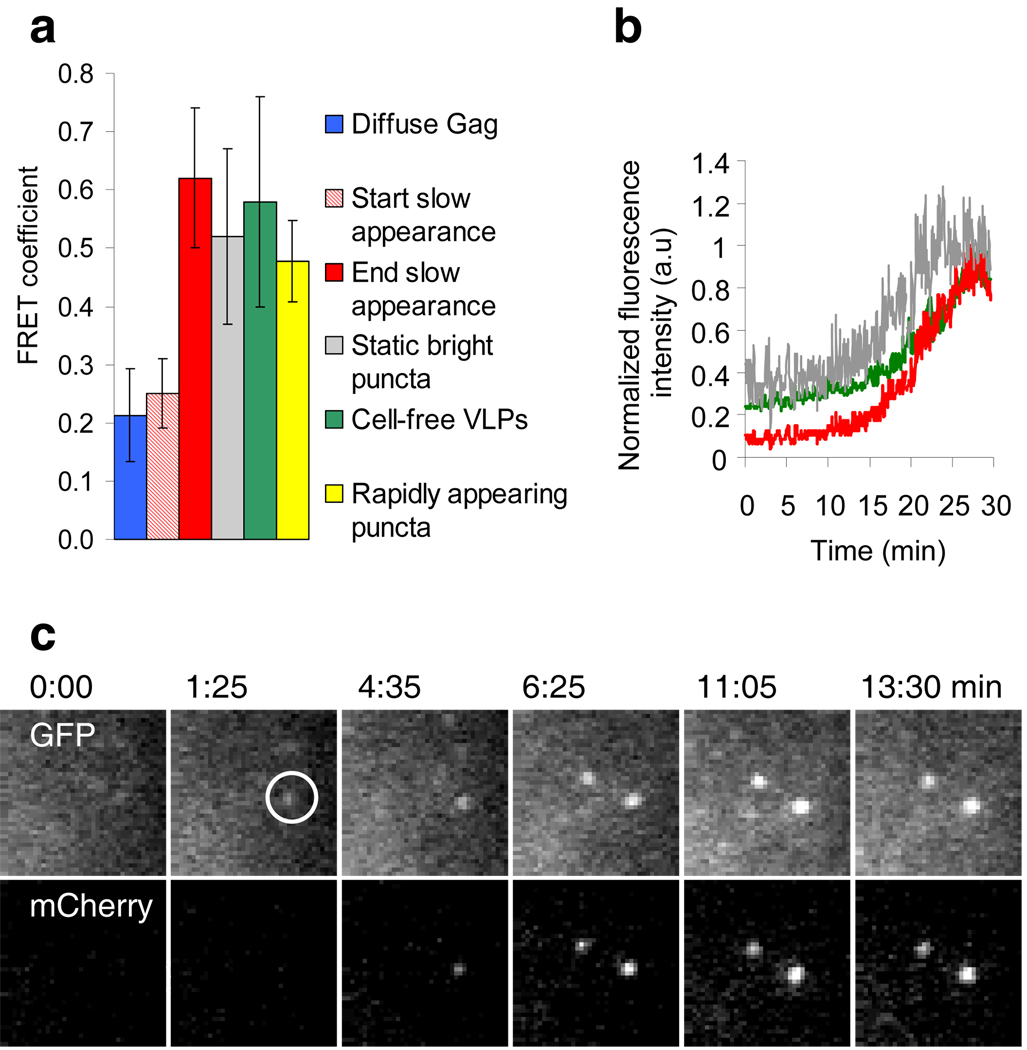
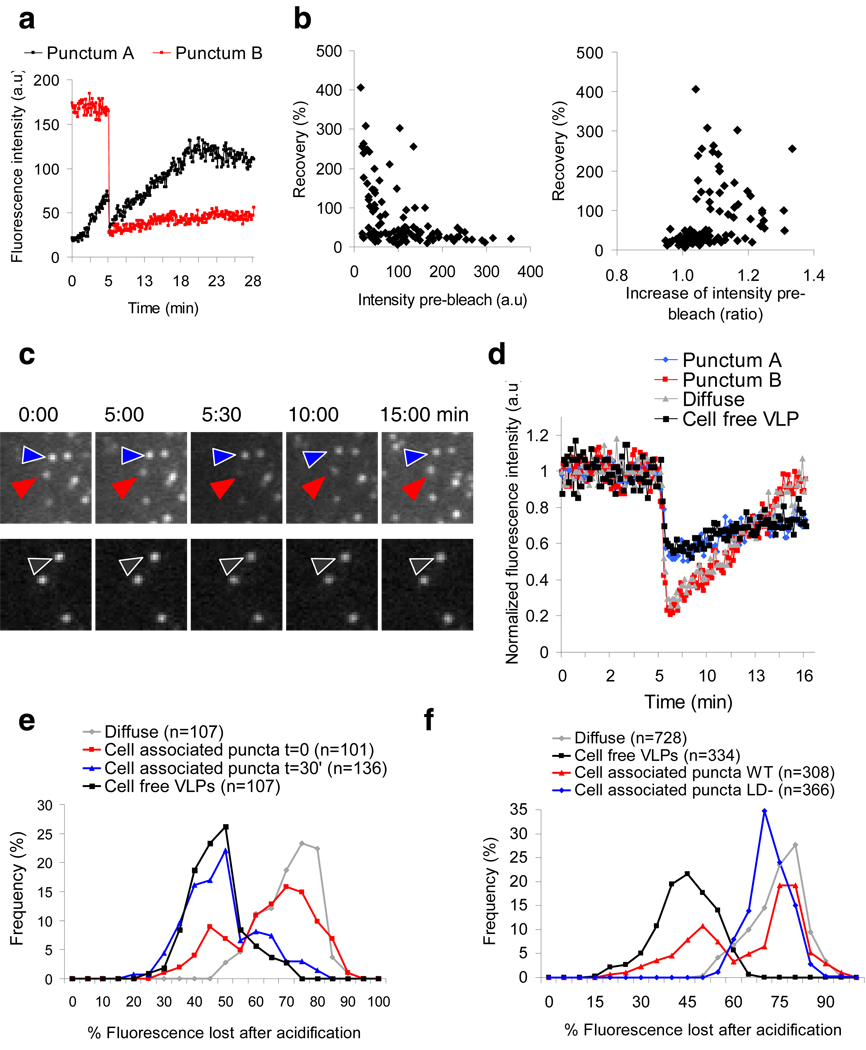
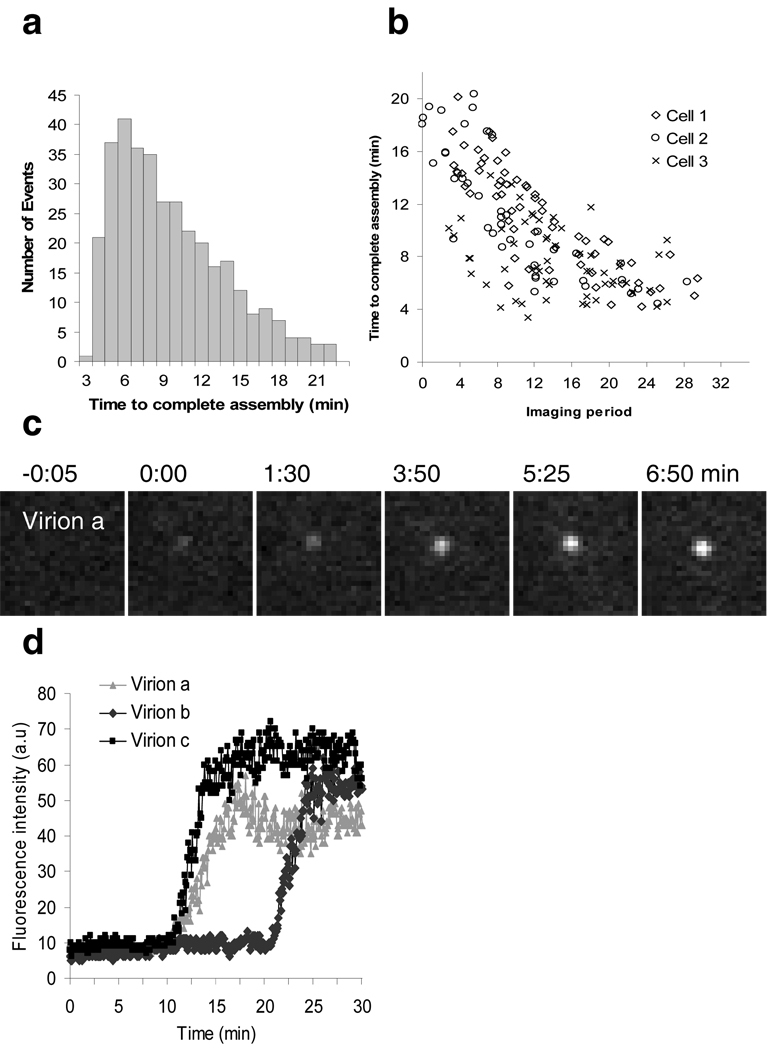
Observations of individual virions in live cells have led to the characterization of their attachment, entry and intracellular transport. However, the assembly of individual virions has never been observed in real time. Insights into this process have come primarily from biochemical analyses of populations of virions or from microscopic studies of fixed infected cells. Thus, some assembly properties, such as kinetics and location, are either unknown or controversial. Here we describe quantitatively the genesis of individual virions in real time, from initiation of assembly to budding and release. We studied fluorescently tagged derivatives of Gag, the major structural component of HIV-1-which is sufficient to drive the assembly of virus-like particles-with the use of fluorescence resonance energy transfer, fluorescence recovery after photobleaching and total-internal-reflection fluorescent microscopy in living cells. Virions appeared individually at the plasma membrane, their assembly rate accelerated as Gag protein accumulated in cells, and typically 5-6 min was required to complete the assembly of a single virion. These approaches allow a previously unobserved view of the genesis of individual virions and the determination of parameters of viral assembly that are inaccessible with conventional techniques.


Figures

Figure 1
Figure 1. Two distinct behaviors of HIV-1 Gag puncta at the plasma membrane
a, Images illustrating slowly (top panels, arrowheads) and rapidly (bottom panels) appearing Gag-GFP puncta. Fields are 5.5×5.5µm. b, Fluorescence intensity in arbitrary units (a.u.) plotted over time for 7 slowly appearing puncta (left, colored lines) and for 7 rapidly appearing puncta (right) and 7 random areas where no puncta appeared (left, black line). c, The change in CD63 or clathrin fluorescence is plotted against the corresponding change in Gag-GFP during the appearance of 25 rapidly and slowly emerging puncta, as well as against the corresponding changes at random areas where no puncta appeared.
Figure 2
Figure 2. FRET analysis of individual Gag puncta
Untagged Gag, Gag-mCherry and Gag-GFP were co-expressed and the cells illuminated with a 488 nm laser. a, FRET coefficients measured at the beginning and the end of the slow appearance of individual puncta (n=30), compared to FRET coefficients at randomly chosen areas containing diffuse Gag (n=30), in static bright puncta (n=30), in cell-free VLPs (n=100) or in rapidly appearing puncta (n=30). b, Plots of the normalized fluorescence intensity of GFP, corrected mCherry and the FRET coefficient during appearance of the punctum shown in (c). Additional examples are shown in supplementary fig 5. c, Images of GFP and corrected mCherry fluorescence (due to FRET) during slow appearance of a punctum. Fields are 5.5×5.5µm.
Figure 3
Figure 3. FRAP analysis of individual Gag puncta
a, Plots of Gag-GFP fluorescence intensity over time for the red and black puncta shown in supplementary fig 6. b, Fluorescence recovery of 100 puncta plotted as a function of either their absolute pre-bleach intensity (left panel) or the fold increase in their intensity before bleaching (1 means no increase, >1 means increasing, right panel). c, Images showing Gag-pHluorin puncta before and after the CO2-mediated acidification. Cells (top panels) or cell-free VLPs (bottom panels) were incubated with pCO2 after 5 min of imaging, for 30 sec. The arrows indicate one pCO2-‘sensitive’ punctum (red), one pCO2-‘insensitive’ punctum (blue) and one cell-free VLP (black). Fields are 3.5×3.5µm. d, Plots of normalized fluorescence intensity over time for the 3 Gag-pHluorin puncta indicated in (d) (bearing the same color coding), as well as for a diffuse Gag area. e, Loss of fluorescence immediately following pCO2 mediated acidification for diffuse Gag, cell-free VLPs and Gag puncta at t=0 and t=30’ of imaging. f, Loss of fluorescence immediately following pCO2 mediated acidification of diffuse Gag, cell-free VLPs and Gag with a late domain mutation.
Figure 4
Figure 4. Variation in HIV-1 assembly kinetics
a, Distribution of the time to complete assembly for 370 individual VLPs in 11 HeLa cells expressing Gag/Gag-GFP. Time to complete assembly was defined as the interval between the points of inflection on plots of fluorescence intensity against time, for each VLP (for instance Figs 1b, c). b, Time to complete assembly is plotted against the time at which assembly commenced in 3 cells imaged for 40 minutes. T=0 is defined as the time at which observation began, i.e. when >1 but < 20 VLPs were visible in the TIR field for each cell. c–d. Assembly of HIV-1 particles from full-length proviral plasmids. c, Images of an individual HIV-1 virion assembly event. Fields are 5.5×5.5µm. d, Plots of the fluorescence intensity over time for 3 assembly events, including the one shown in (c).

References

    1. Brandenburg B, Zhuang X. Virus trafficking-learning from single-virus tracking. Nat Rev Microbiol. 2007;5:197–208. - PMC - PubMed
    1. Pelchen-Matthews A, Kramer B, Marsh M. Infectious HIV-1 assembles in late endosomes in primary macrophages. J Cell Biol. 2003;162:443–455. - PMC - PubMed
    1. Sherer NM, et al. Visualization of retroviral replication in living cells reveals budding into multivesicular bodies. Traffic. 2003;4:785–801. - PubMed
    1. Jouvenet N, et al. Plasma membrane is the site of productive HIV-1 particle assembly. PLoS Biol. 2006;4:e435. - PMC - PubMed
    1. Welsch S, et al. HIV-1 buds predominantly at the plasma membrane of primary human macrophages. PLoS Pathog. 2007;3:e36. - PMC - PubMed

Publication types

Substances